EUR/JPY Price Analysis: Euro steady near mid-range as bullish signals hold ahead of Asia
- EUR/JPY trades near the 162.20 zone with mild gains on Monday ahead of the Asian session.
- The overall bias remains bullish despite mixed indicator signals.
- Key supports and resistances emerge as the pair consolidates near short-term moving averages.

The EUR/JPY is trading with slight gains near the 162.20 zone on Monday's session ahead of the Asian open, reflecting a cautious but positive mood. After modest fluctuations during the European hours, the pair stabilizes mid-range, hinting at a market waiting for fresh catalysts in Asia. Overall, today’s movement shows resilience, with the pair clinging to its recent gains and technical indicators offering a mixed but slightly bullish tone.
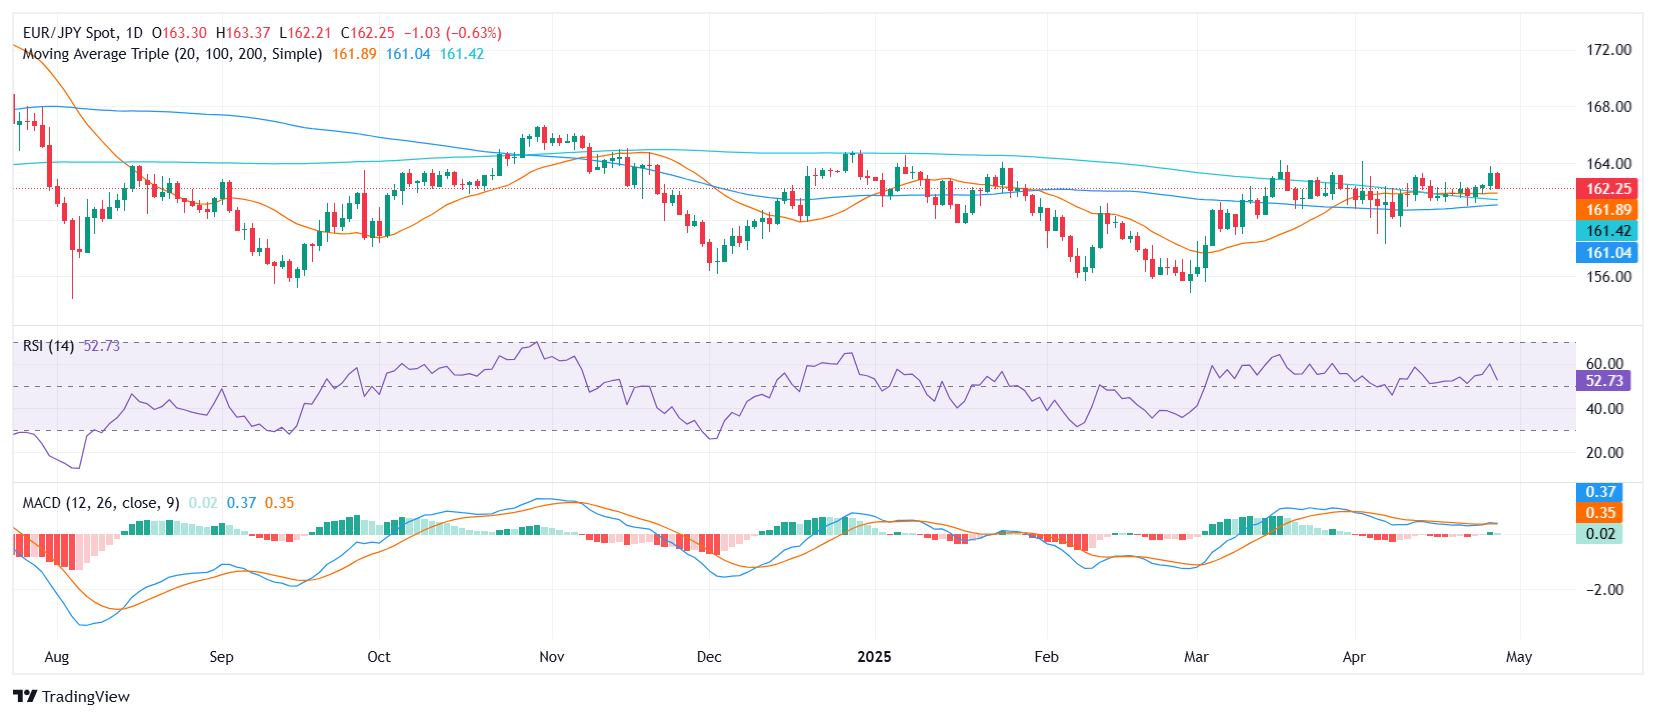
Looking at the technical setup, the Relative Strength Index (RSI) stands around 53, offering a neutral view and indicating no immediate overbought or oversold conditions. Meanwhile, the Moving Average Convergence Divergence (MACD) shows a mild sell signal, suggesting some potential for short-term consolidation. However, other indicators such as the Bull Bear Power (around 0.09) and the Stochastic %K (near 67) maintain a neutral stance, adding to the cautious sentiment.
Despite some neutral and bearish signals, the broader structure leans bullish. The 10-day, 20-day, 100-day, and 200-day Simple Moving Averages (SMA) all point higher, reinforcing the underlying strength of the Euro against the Yen. The 30-day Exponential Moving Average (EMA) around 161.78 further supports this positive outlook.
On the support side, immediate cushions are found near 162.19, 162.02, and 161.98, zones that may attract buyers if prices dip. Resistance levels to watch are placed around 162.25 and 162.73, marking potential hurdles for bulls aiming for further gains.
Overall, while short-term momentum is somewhat mixed, the bullish alignment of the major moving averages suggests that dips may be shallow and temporary, keeping the EUR/JPY’s upward bias intact ahead of the Asian session.
Daily Chart
Author

Patricio Martín
FXStreet
Patricio is an economist from Argentina passionate about global finance and understanding the daily movements of the markets.