|

EUR/JPY price analysis: Euro drops against yen, trades near 120.00 handle

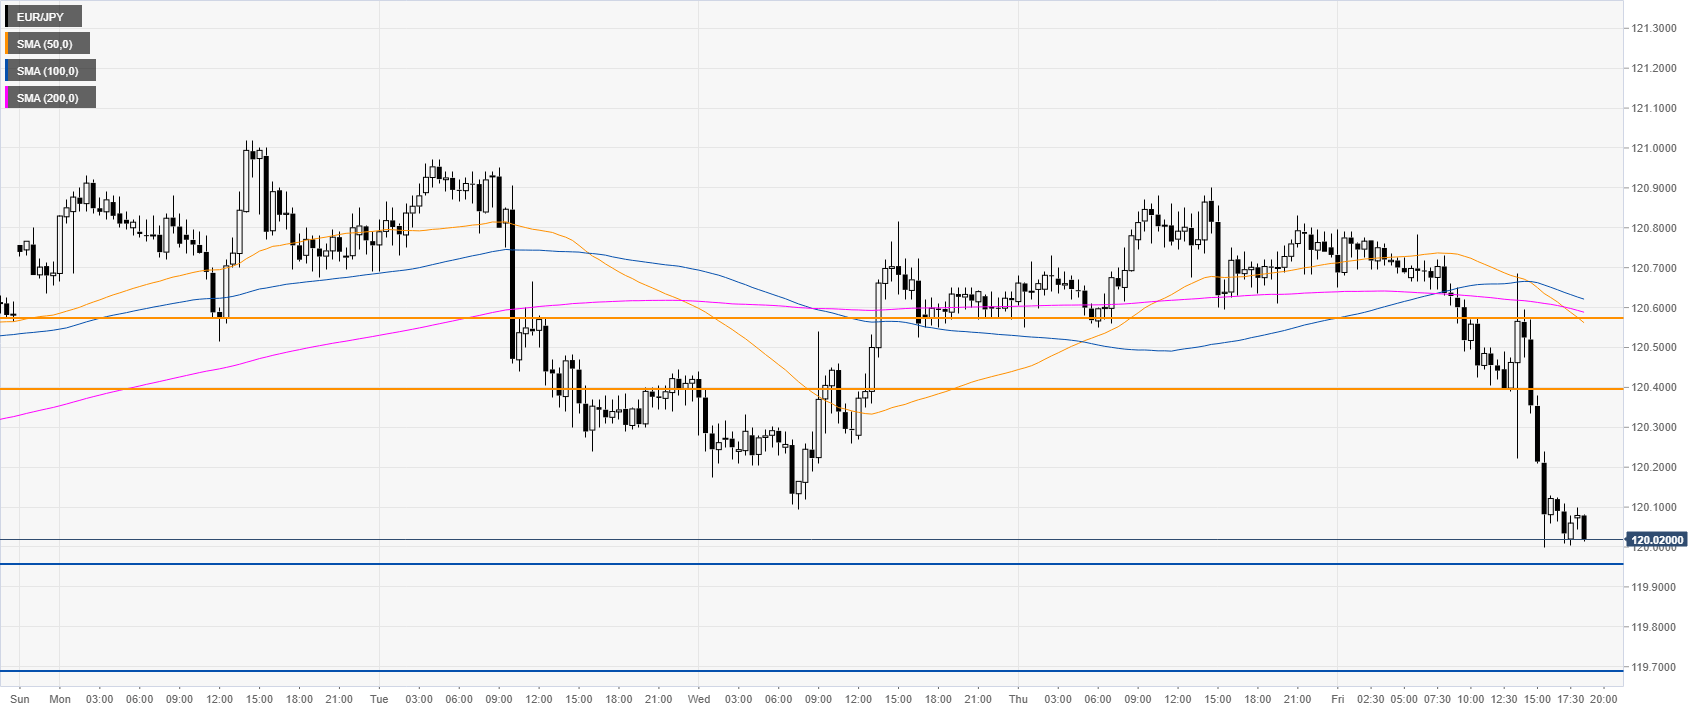
  • EUR/JPY dived on Friday, breaking below the 120.56 support level. 
  • The level to beat for sellers is the 119.95 support. 
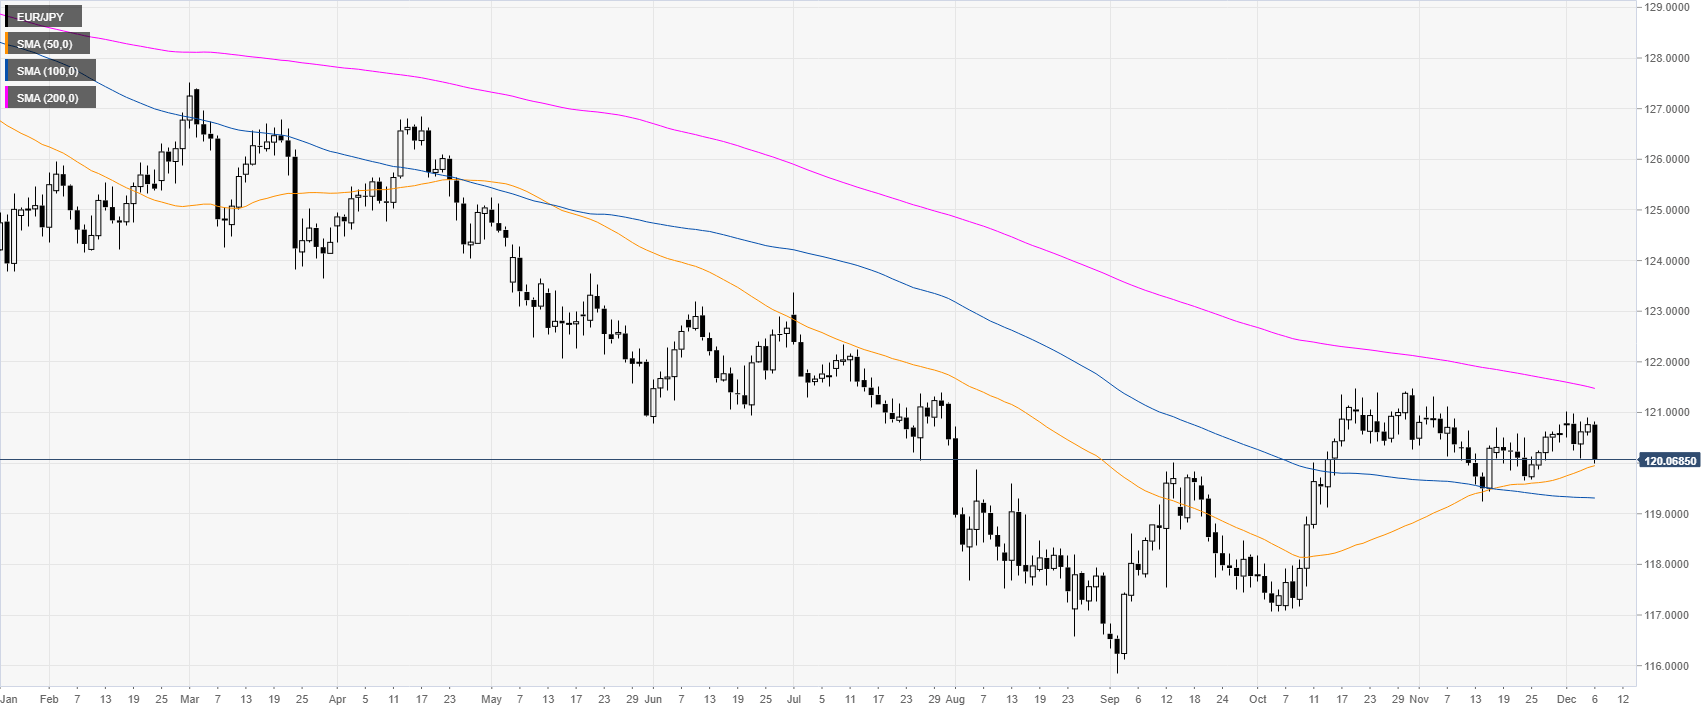
 

EUR/JPY daily chart

 
EUR/JPY is trading in a bear trend below the 200-day simple moving average (DMA). However, the spot has been correcting below the 121.00 handle in the last weeks of trading. 
 

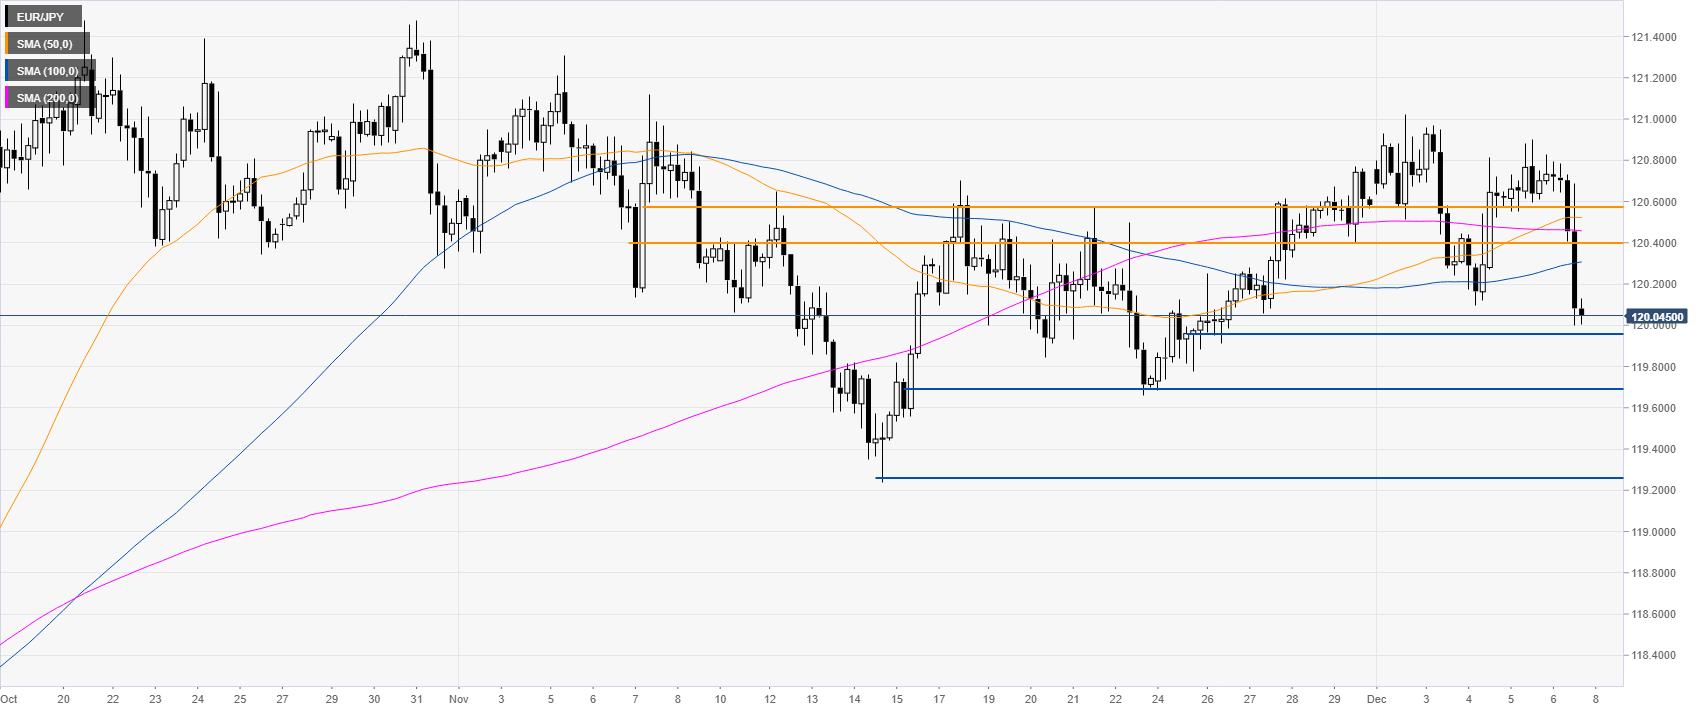
EUR/JPY four-hour chart

 
As discussed yesterday, the spot dropped to the 120.06 price level. As bears are in control, next week, if the spot break below 119.95, it could continue to decline towards 119.70 and 119.27, according to the Technical Confluences Indicator
   

EUR/JPY 30-minute chart

 
The cross is under pressure below its main SMAs on the 30-minute chart. Resistances are seen at the 120.39 and 120.60 level. 


Additional key levels

EUR/JPY

Overview
Today last price120.04
Today Daily Change-0.72
Today Daily Change %-0.60
Today daily open120.76
 
Trends
Daily SMA20120.26
Daily SMA50119.91
Daily SMA100119.32
Daily SMA200121.51
 
Levels
Previous Daily High120.9
Previous Daily Low120.55
Previous Weekly High120.77
Previous Weekly Low119.68
Previous Monthly High121.31
Previous Monthly Low119.24
Daily Fibonacci 38.2%120.77
Daily Fibonacci 61.8%120.68
Daily Pivot Point S1120.57
Daily Pivot Point S2120.39
Daily Pivot Point S3120.22
Daily Pivot Point R1120.92
Daily Pivot Point R2121.09
Daily Pivot Point R3121.27

Author

Flavio Tosti

Flavio Tosti

Independent Analyst


More from Flavio Tosti
Share:

Editor's Picks

EUR/USD eyes nine-day EMA barrier after rebounding from 1.1600

EUR/USD gains ground after registering modest losses in the previous session, trading around 1.1620 during the Asian hours on Friday. The technical analysis of the daily chart suggests an ongoing bearish bias as the pair remains within the descending channel pattern.

GBP/USD drifts lower heading into NFP range

GBP/USD edged lower by 0.2% on Thursday, settling close to 1.3350 in a strained trading session that kept the pair pinned near three-month lows. Price briefly recovered earlier in the day on reports that Iran had indirectly signaled openness to talks with the CIA, but the bounce faded as Israeli officials reportedly advised Washington to disregard the overture. 

Gold awaits US Nonfarm Payrolls for a clear directional impetus

Gold rebounds above $5,100 early Friday after testing the $5,050 level amid global sell-off. The US Dollar pulls back as profit-taking creeps in ahead of US labor data. For February. 21-day SMA holds amid bullish RSI; a daily closing above 61.8% Fibo is critical for Gold buyers.

Ethereum pull in $169M as validators pile in to stake ETH

US spot Ethereum exchange-traded funds recorded $169 million in net inflows on Wednesday, marking the largest daily intake in two months, according to SoSoValue data. The rise in inflows signals renewed institutional interest in Ethereum amid broader market volatility.

The market compass is pointing at a barrel of Oil

The Asian open is arriving with equities leaning the wrong way, and the reason is not complicated. The market’s compass needle has snapped firmly toward crude. In this tape, oil is not just another input price; it is the gravitational center around which every asset class is orbiting.

Ripple tests recovery strength amid steady ETF inflows, growing retail interest

Ripple (XRP) continues to demonstrate notable resilience as the cryptocurrency market navigates the persistent war in the Middle East after the United States (US) and Israel attacked Iran on Saturday.