|
EUR/JPY Price Analysis: Euro challenging December highs, approaching the 121.00 handle
- EUR/JPY is rolling into Asia near the 120.85 resistance level.
- Support is seen at the 120.66 and 120.40 levels.

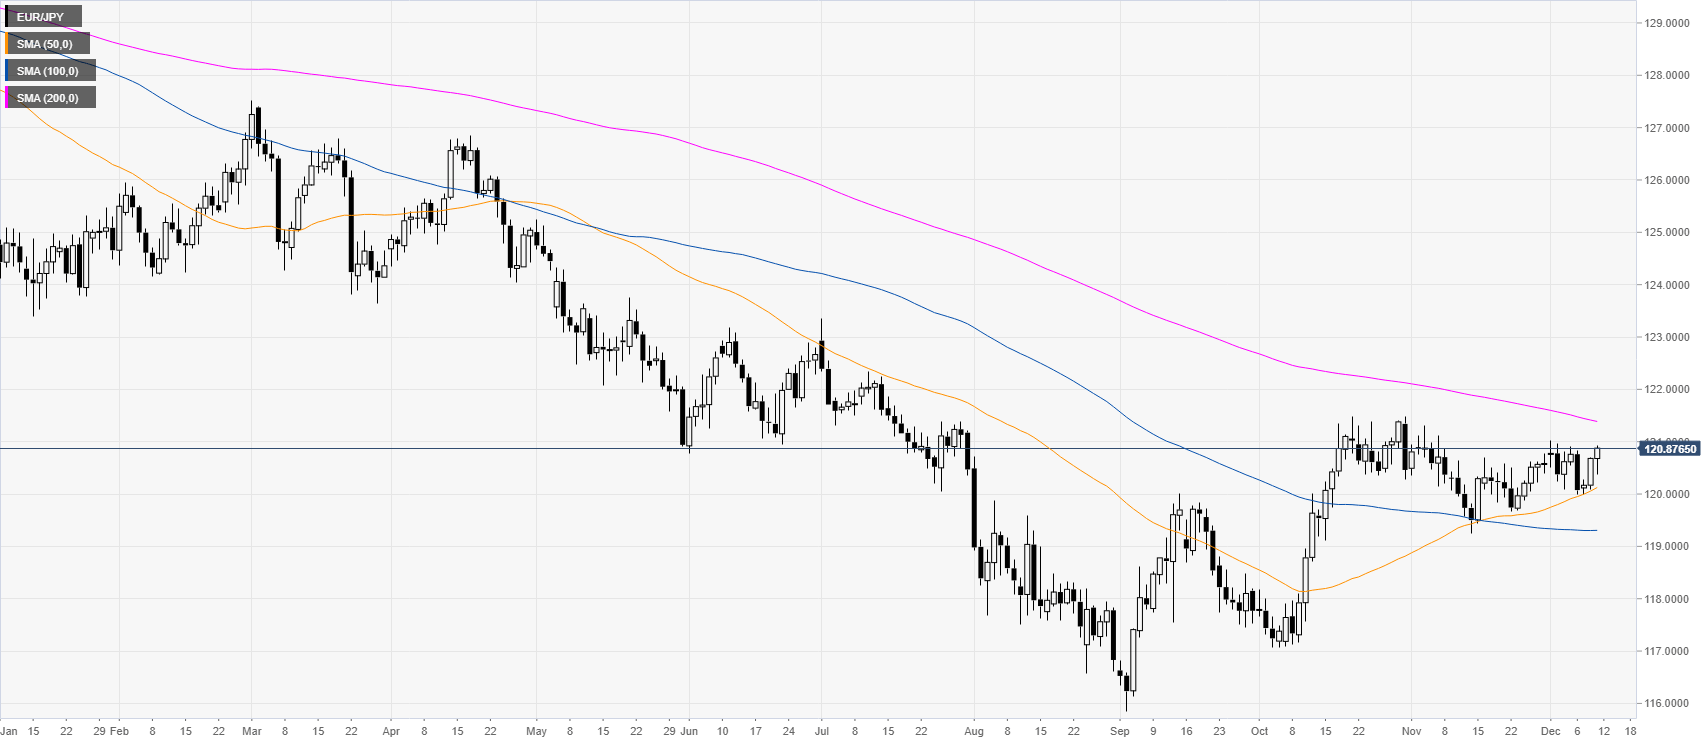
EUR/JPY daily chart
EUR/JPY is trading in a bear trend below the 200-day simple moving average (DMA). However, the spot has been correcting the October’s rally below the 121.00 handle in the last weeks of trading.
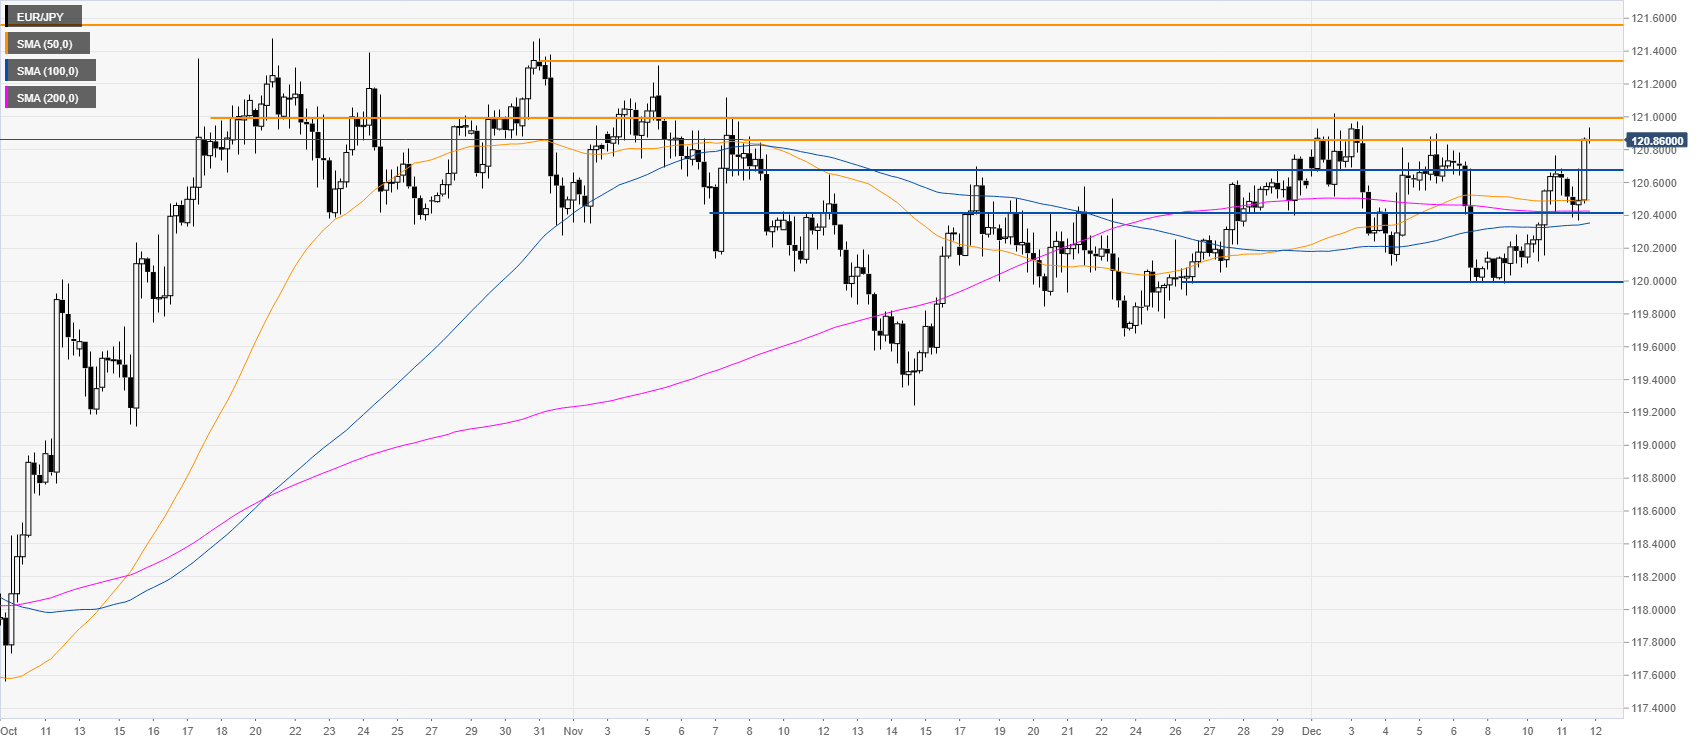
EUR/JPY four-hour chart
Buyers broke above the 120.66 resistance and are now challenging the 120.85 level. The next big hurdle is likely going to be the 121.00 handle. If the bulls can break above it, the path of least resistance would probably be to the upside with investors potentially targetting the 121.35 and 121.55 levels, according to the Technical Confluences Indicator.
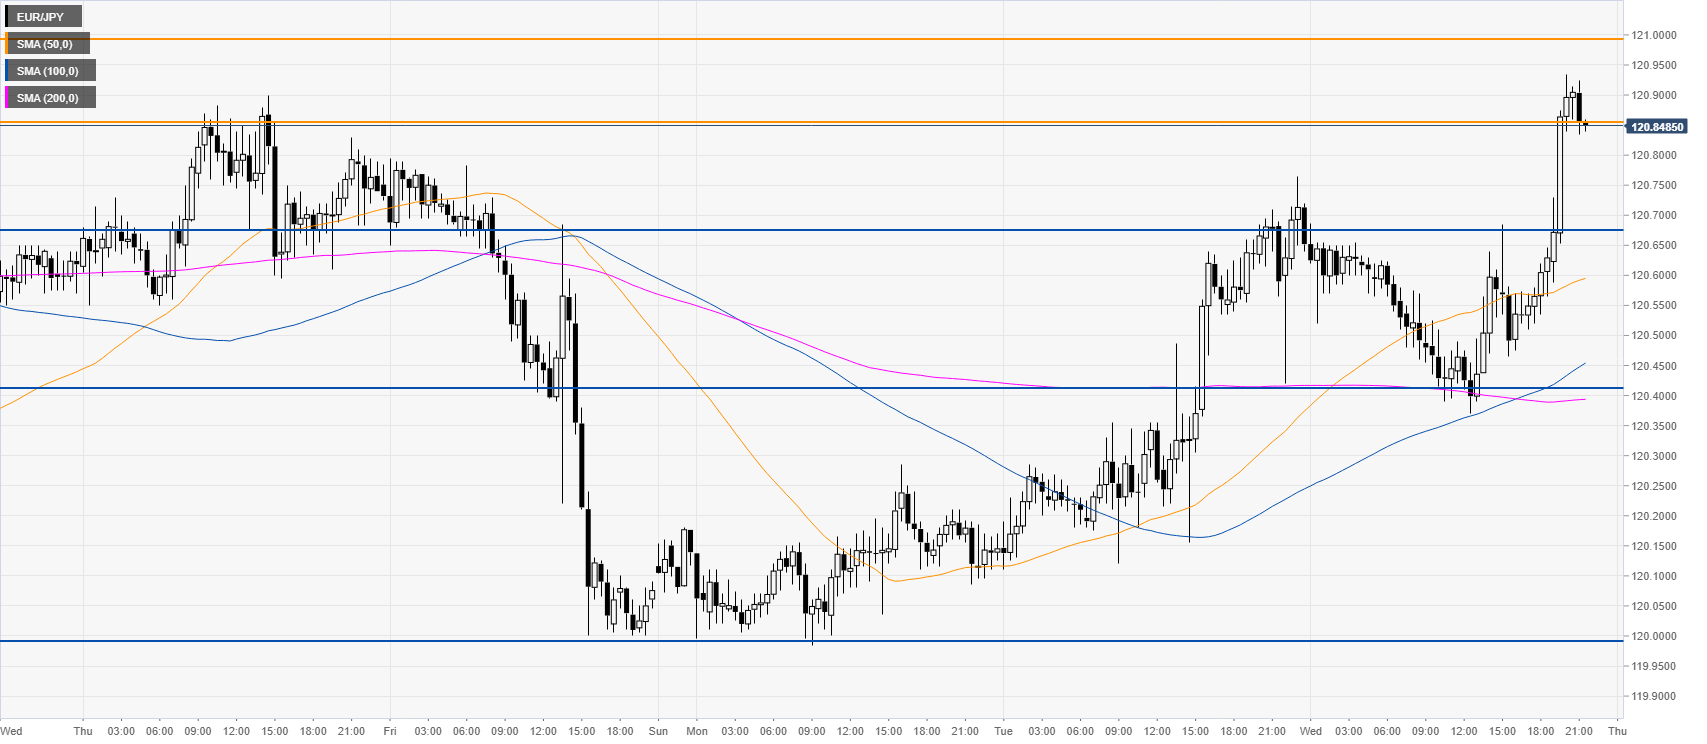
EUR/JPY 30-minute chart
The bulls are in control above the main SMAs on the 30-minute chart. Support is seen at the 120.66 and 120.40 levels.
Additional key levels
Author

Flavio Tosti
Independent Analyst
More from Flavio Tosti


