|

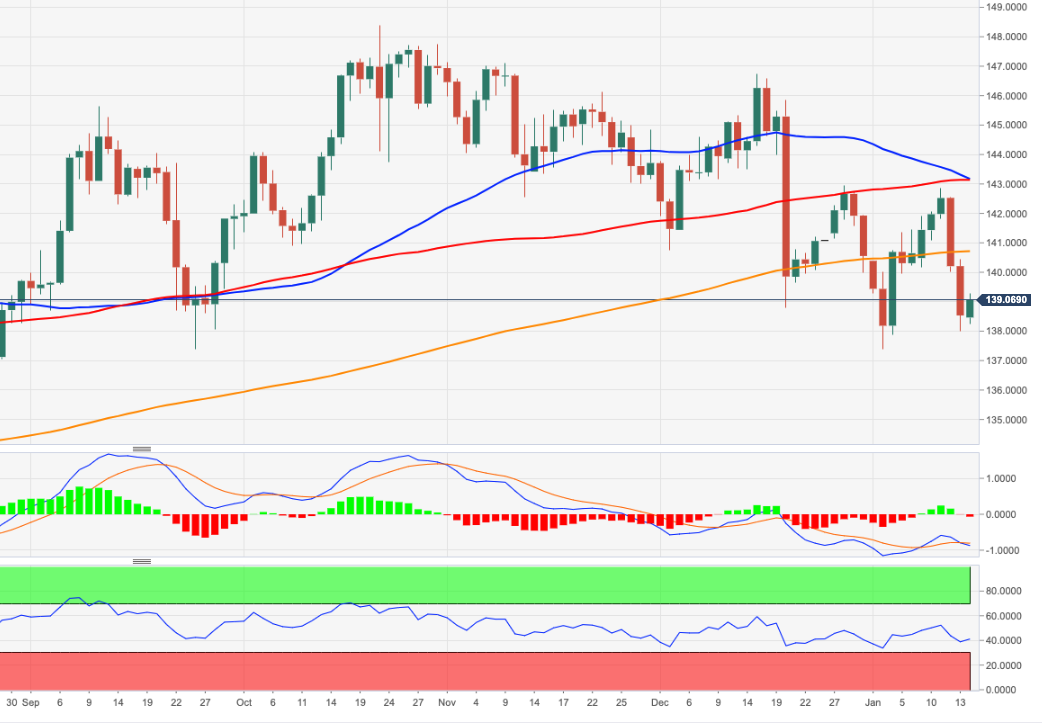
EUR/JPY Price Analysis: Downside pressure alleviated above the 200-day SMA

  • EUR/JPY manages to grab some upside traction above 139.00.
  • Next on the upside for the cross appears the 200-day SMA.

EUR/JPY gathers some much needed steam and reclaims the 139.00 hurdle and beyond at the beginning of the week.

The recent pronounced correction in the cross seems to have met some contention around the 138.00 neighbourhood. If the rebound picks up a more sustainable pace, then the next target of note turns up at the key 200-day SMA, today at 140.68.

Above the latter, the selling bias is expected to mitigate and could shift the outlook to a more constructive one.

EUR/JPY daily chart

EUR/JPY

Overview
Today last price139.1
Today Daily Change104
Today Daily Change %0.40
Today daily open138.54
 
Trends
Daily SMA20140.96
Daily SMA50143.07
Daily SMA100143.14
Daily SMA200140.7
 
Levels
Previous Daily High140.44
Previous Daily Low138.01
Previous Weekly High142.86
Previous Weekly Low138.01
Previous Monthly High146.73
Previous Monthly Low138.8
Daily Fibonacci 38.2%138.94
Daily Fibonacci 61.8%139.51
Daily Pivot Point S1137.55
Daily Pivot Point S2136.57
Daily Pivot Point S3135.13
Daily Pivot Point R1139.98
Daily Pivot Point R2141.42
Daily Pivot Point R3142.4

Author

Pablo Piovano

Born and bred in Argentina, Pablo has been carrying on with his passion for FX markets and trading since his first college years.

More from Pablo Piovano
Share:

Markets move fast. We move first.

Orange Juice Newsletter brings you expert driven insights - not headlines. Every day on your inbox.

By subscribing you agree to our Terms and conditions.

Editor's Picks

EUR/USD bears await break below 100-day SMA support near 1.1665 area

The EUR/USD pair attracts heavy selling for the second straight day and dives to a nearly four-week trough, around the 1.1670 region, during the Asian session on Monday. Bearish traders now await a sustained break below the 100-day Simple Moving Average before positioning for an extension of the recent pullback from a three-month top, or levels just above the 1.1800 mark touched on December 24.

GBP/USD falls toward 1.3400 near 50-day EMA

GBP/USD extends its losses for the second successive session, trading around 1.3420 during the Asian hours on Monday. The technical analysis of the daily chart indicates that the 14-day Relative Strength Index at 53 has eased from near overbought, indicating that momentum has cooled while remaining above the midline. RSI holds above 50, keeping a modest bullish bias.

Gold on fire at the start of the week on US-Venezuela tensions

Gold regains upside traction early Monday as flight to safety prevails on Venezuela turmoil. The US Dollar finds strong haven demand, caps Gold’s upside as focus shifts to US jobs data. Gold’s daily technical setup suggests that more upside remains in the offing.

Bulls firmly in control as Bitcoin breaks $93K, Ethereum and Ripple extend gains

Bitcoin, Ethereum, and Ripple extended their rallies on Monday, gaining more than 4%, 6%, and 12%, respectively, in the previous week. The top three cryptocurrencies by market capitalization could continue to outperform, with bulls in control of the momentum.

Economic outlook 2026-2027 in advanced countries: Solidity test

After a year marked by global economic resilience and ending on a note of optimism, 2026 looks promising and could be a year of solid economic performance. In our baseline scenario, we expect most of the supportive factors at work in 2025 to continue to play a role in 2026.

Meme Coins Price Prediction: Dogecoin, Shiba Inu, Pepe rally on Venezuela’s shadow BTC reserve

Meme coins such as Dogecoin, Shiba Inu, and Pepe are leading the cryptocurrency market rally driven by the US cross-border operation to capture Venezuelan President Nicolás Maduro. Dogecoin extends its gain for the fifth consecutive day while SHIB and PEPE take a pause.