|

EUR/JPY Price Analysis: Dives sharply below 137.00 as risk appetite improves

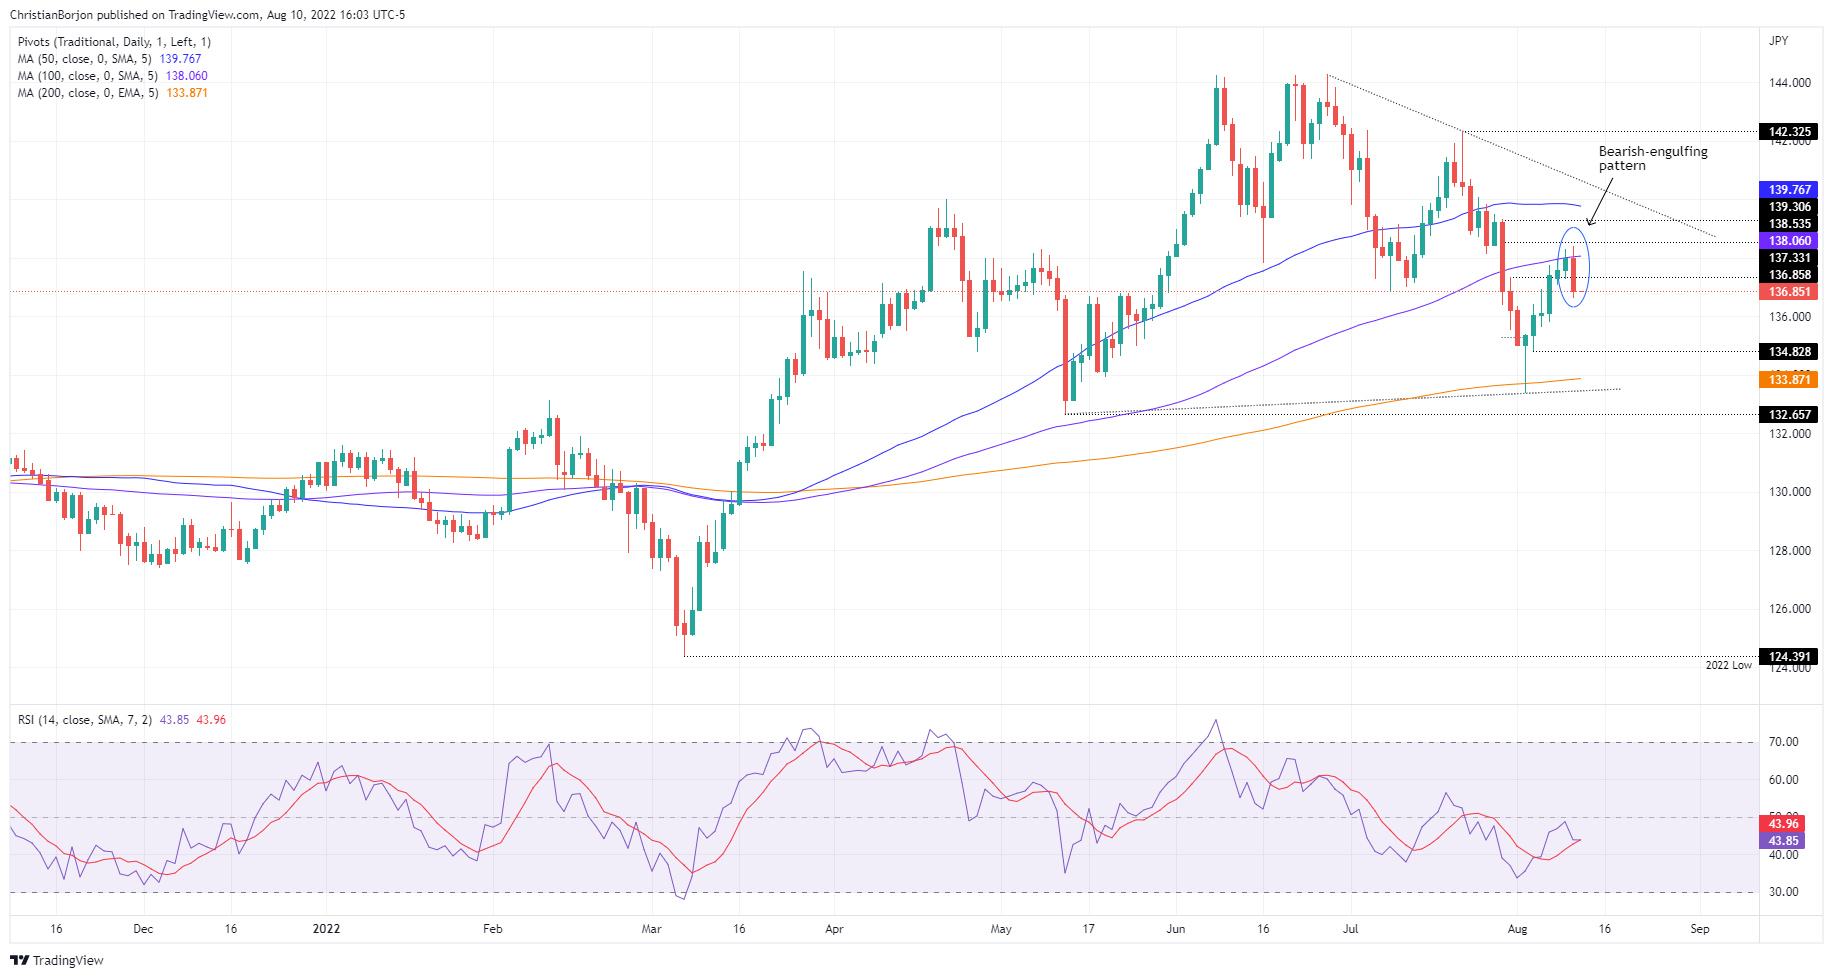
  • EUR/JPY daily chart forms a bearish-engulfing candle pattern with bearish implications.
  • In the short-term, the EUR/JPY might print a leg-up before extending the downtrend.

The EUR/JPY plunged on Wednesday due to a risk-on impulse spurred by US inflation data, which ticked lower, dissipating the Federal Reserve’s need for an aggressive tightening. The reaction was that the US 10-year bond yield retraced, dragging the USD/JPY. Hence, the EUR/JPY followed suit, diving more than 100 pips towards its daily low at 136.94. At the time of writing, the EUR/JPY is trading at 136.86, down 0.81%.

EUR/JPY Price Analysis: Technical outlook

From a daily chart perspective, the EUR/JPY is forming a bearish-engulfing candle pattern, meaning that sellers outweighed buyers. Additionally, the cross-currency tumbled below the 100-day EMA at 138.03 and, at the time of writing, is testing the August 4 high at 136.92, previous resistance-turned-support. If the latter is broken, that will keep sellers in the driver’s seat, paving the way for further losses.

EUR/JPY Daily chart

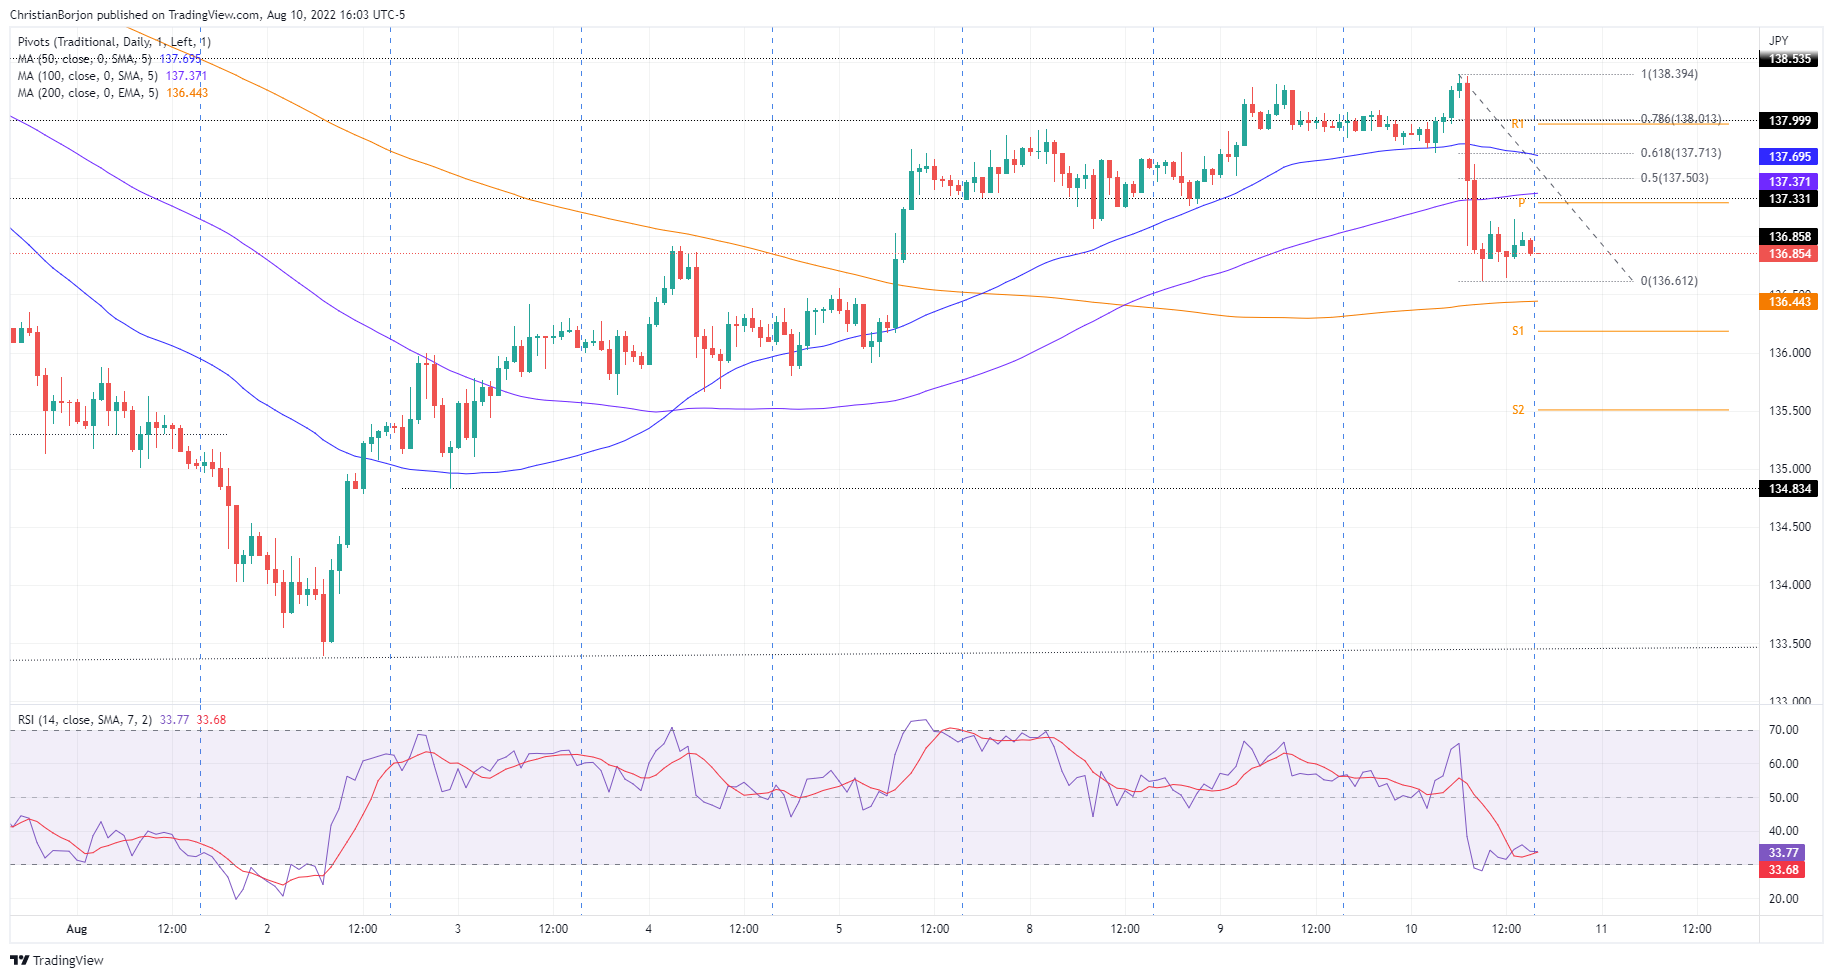
Short-term, the EUR/JPY hourly chart, illustrates the pair as neutral-upwards, but prices falling below the weekly opening price of 137.32, might pave the way for further losses. The downtrend seems to lose steam as the Relative Strength Index (RSI) entered oversold conditions, which means that the EUR/JPY might print a leg-up towards the 50% Fibonacci retracement at 137.50 before resuming the downtrend.

If the above scenario plays out, the EUR/JPY first support would be the 137.00 figure. Once cleared, the next support level will be the August 10 low at 136.61, followed by the 200-hour EMA at 136.44, before sliding to the psychological 136.00 figure.

EUR/JPY Hourly chart

EUR/JPY Key Technical Levels

EUR/JPY

Overview
Today last price136.89
Today Daily Change-1.00
Today Daily Change %-0.73
Today daily open137.89
 
Trends
Daily SMA20138.23
Daily SMA50139.89
Daily SMA100138.04
Daily SMA200133.85
 
Levels
Previous Daily High138.32
Previous Daily Low137.26
Previous Weekly High137.76
Previous Weekly Low133.4
Previous Monthly High142.43
Previous Monthly Low135.55
Daily Fibonacci 38.2%137.91
Daily Fibonacci 61.8%137.67
Daily Pivot Point S1137.33
Daily Pivot Point S2136.77
Daily Pivot Point S3136.28
Daily Pivot Point R1138.38
Daily Pivot Point R2138.87
Daily Pivot Point R3139.43

Author

Christian Borjon Valencia

Christian Borjon began his career as a retail trader in 2010, mainly focused on technical analysis and strategies around it. He started as a swing trader, as he used to work in another industry unrelated to the financial markets.

More from Christian Borjon Valencia
Share:

Markets move fast. We move first.

Orange Juice Newsletter brings you expert driven insights - not headlines. Every day on your inbox.

By subscribing you agree to our Terms and conditions.

Editor's Picks

EUR/USD gathers recovery momentum, trades near 1.1750

Following the correction seen in the second half of the previous week, EUR/USD gathers bullish momentum and trades in positive territory near 1.1750. The US Dollar (USD) struggles to attract buyers and supports the pair as investors await Tuesday's GDP data ahead of the Christmas holiday. 

GBP/USD knocks ten-week highs ahead of holiday slowdown

GBP/USD found room on the high side on Monday, kicking off a holiday-shortened trading week with a fresh spat of Greenback weakness, bolstering the Pound Sterling into its highest bids in ten weeks. Pound traders are largely brushing off the latest interest rate cut from the Bank of England as the UK’s central bank policy strategy leaves the water murky for rate-cut watchers.

Gold buying remains unabated; fresh all-time peak and counting

Gold builds on the previous day's blowout rally through the $4,400 mark and continues scaling new record highs through the Asian session on Tuesday. Bets for more interest rate cuts by the US Fed, renewed US Dollar selling bias, and rising geopolitical uncertainties turn out to be key factors driving flows towards the bullion. Traders now look to the delayed release of the revised US Q3 GDP print and US Durable Goods Orders for a fresh impetus.

ETHZilla sells over 24,000 ETH, community reacts to shift away from DAT strategy

Peter Thiel-backed ETHZilla announced it sold 24,291 ETH for ~$74.5 million to redeem outstanding senior secured convertible notes. "We plan to use all, or a significant portion, of the proceeds to fund the redemption," ETHZilla noted in a Monday X post.

Ten questions that matter going into 2026

2026 may be less about a neat “base case” and more about a regime shift—the market can reprice what matters most (growth, inflation, fiscal, geopolitics, concentration). The biggest trap is false comfort: the same trades can look defensive… right up until they become crowded.

XRP steadies above $1.90 support as fund inflows and retail demand rise

Ripple (XRP) is stable above support at $1.90 at the time of writing on Monday, after several attempts to break above the $2.00 hurdle failed to materialize last week. Meanwhile, institutional interest in the cross-border remittance token has remained steady.