|

EUR/JPY Price Analysis: Bulls seek a monthly extension, but bears in control on the 4-hour

  • EUR/JPY bears on top n the ower time frames.
  • Bulls are taking charge longer-term as per the monthly chart.

EUR/JPY is under pressure as per the lower time frames and the following is a top-down analysis that arrives at a bullish bias longer term, but bearish for the near term. 

EUR/JPY monthly chart

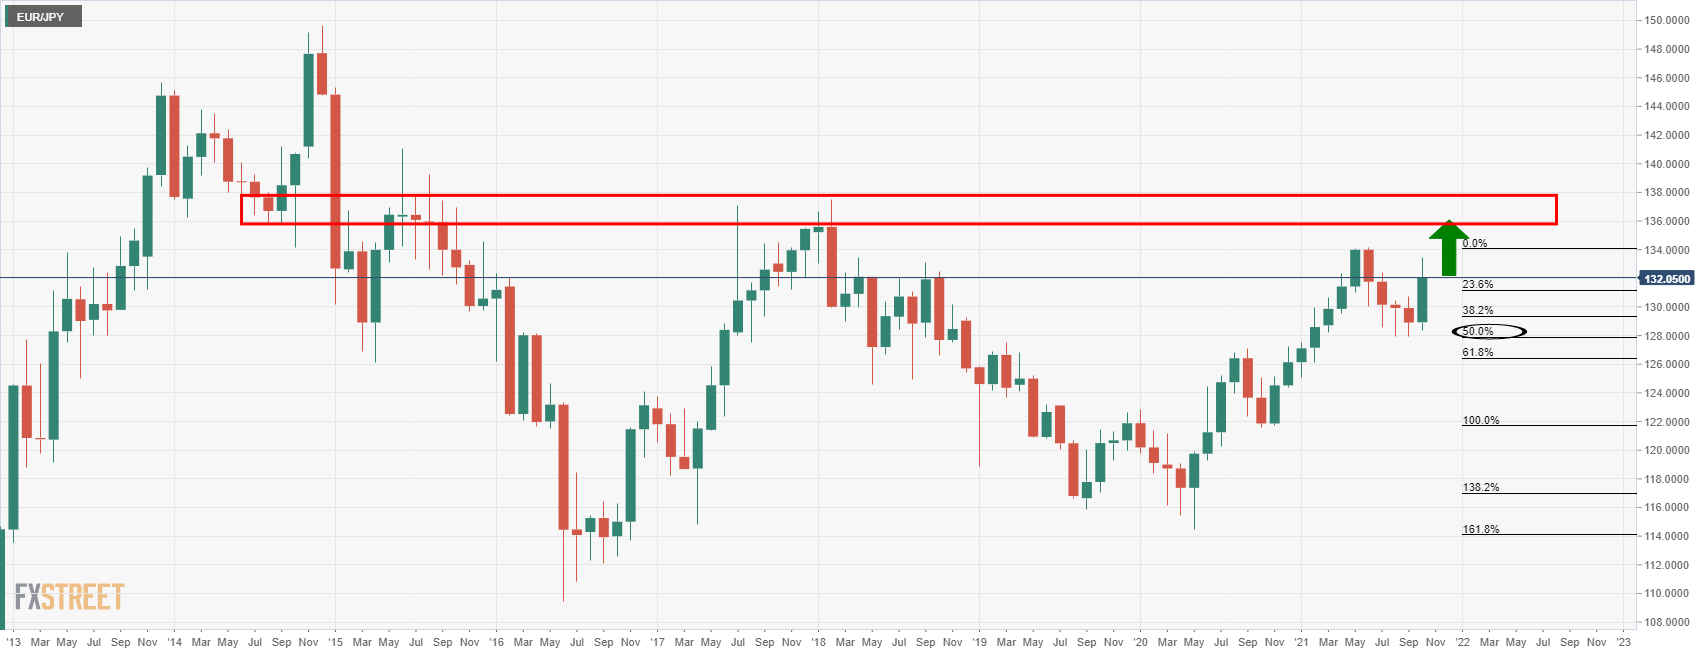
The monthly chart is showing signs of a fresh impulse to the upside, although there could still be some work to be done yet by the bulls according to the lower time frames.

EUR/JPY weekly chart

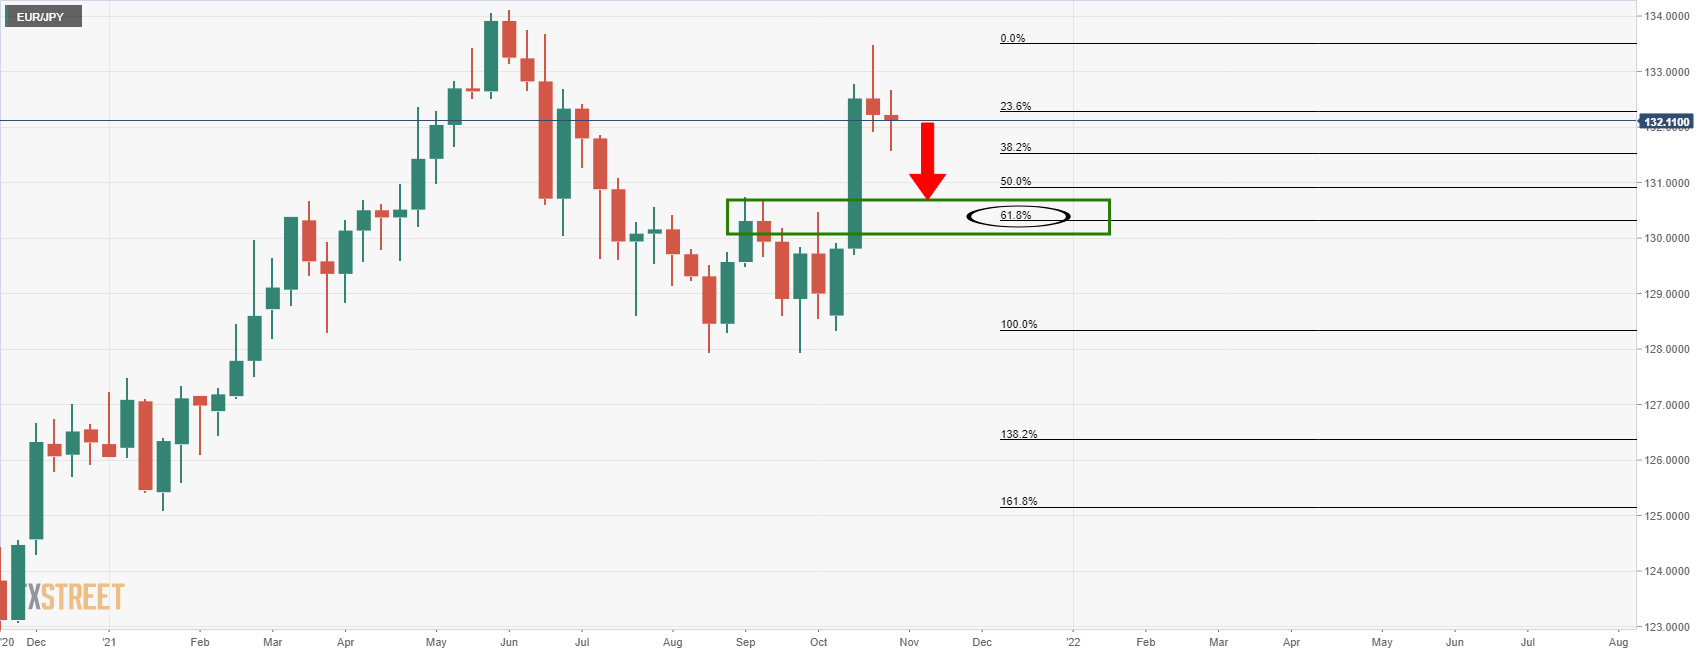
The weekly chart is offering a bearish bias as the price continues to slip following the big rejection wick of last week's business. 

EUR/JPY daily chart

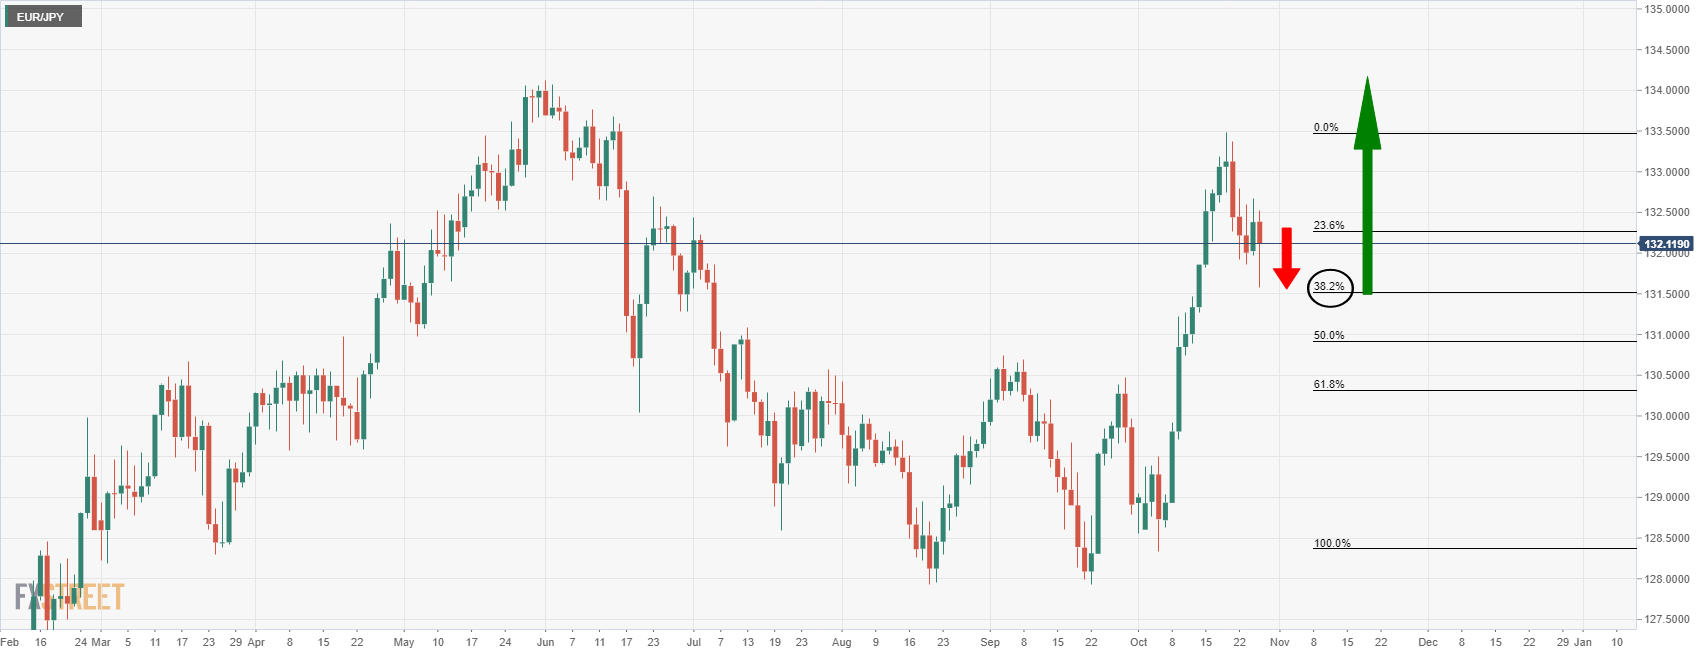
On the daily chart, we can see that the price is attempting to recover from a close touch of the 38.2% Fibonacci. retracement level. However, given the velocity of the correction, the momentum is still with the bears and a visit of 131.50 is probable. 

EUR/JPY 4HR chart

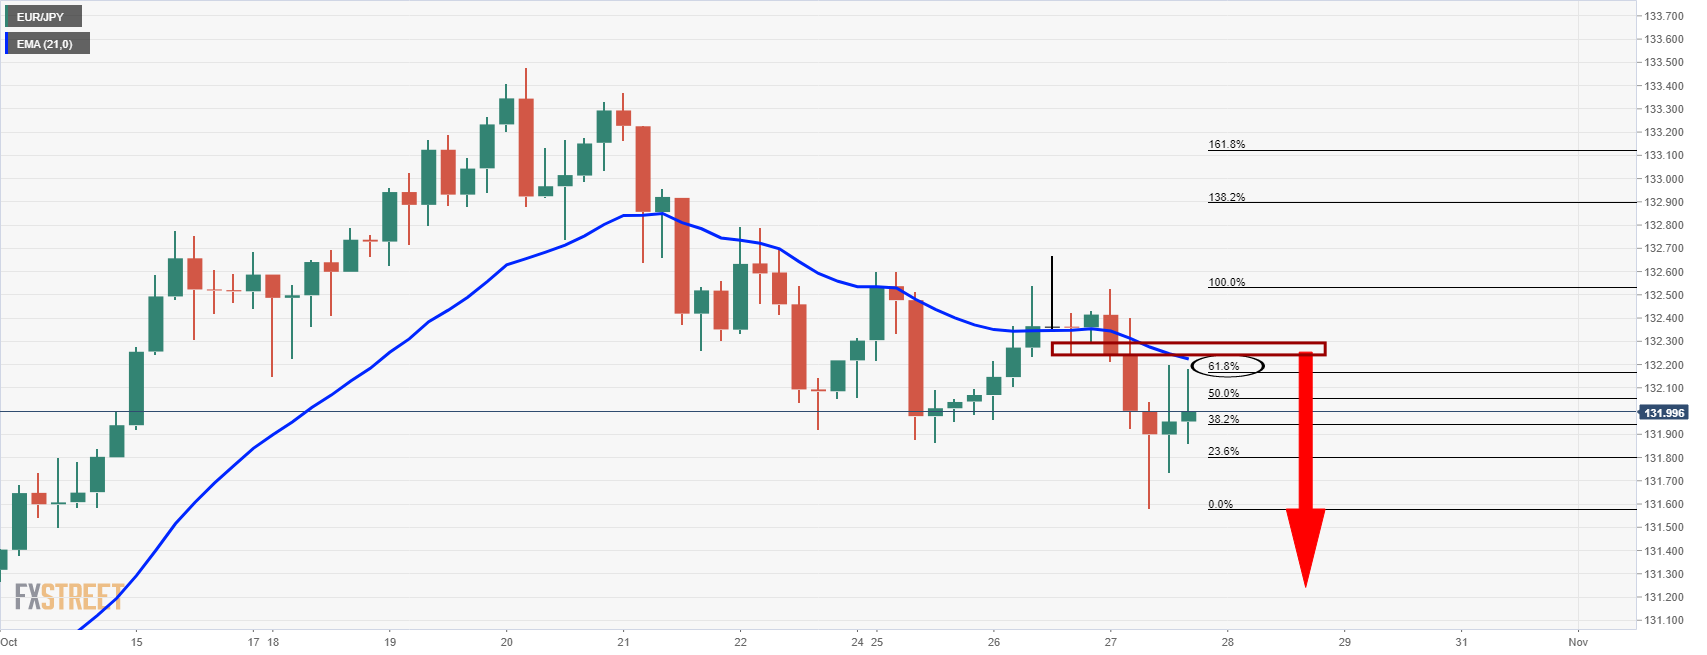
The 4-hour chart is offering a bearish bias also with the price coming in close to the 61.8% Fibonacci retracement level and caped bt the 21-EMA.

Author

Ross J Burland

Ross J Burland, born in England, UK, is a sportsman at heart. He played Rugby and Judo for his county, Kent and the South East of England Rugby team.

More from Ross J Burland
Share:

Editor's Picks

EUR/USD eyes nine-day EMA barrier after rebounding from 1.1600

EUR/USD gains ground after registering modest losses in the previous session, trading around 1.1620 during the Asian hours on Friday. The technical analysis of the daily chart suggests an ongoing bearish bias as the pair remains within the descending channel pattern.

GBP/USD drifts lower heading into NFP range

GBP/USD edged lower by 0.2% on Thursday, settling close to 1.3350 in a strained trading session that kept the pair pinned near three-month lows. Price briefly recovered earlier in the day on reports that Iran had indirectly signaled openness to talks with the CIA, but the bounce faded as Israeli officials reportedly advised Washington to disregard the overture. 

Gold awaits US Nonfarm Payrolls for a clear directional impetus

Gold rebounds above $5,100 early Friday after testing the $5,050 level amid global sell-off. The US Dollar pulls back as profit-taking creeps in ahead of US labor data. For February. 21-day SMA holds amid bullish RSI; a daily closing above 61.8% Fibo is critical for Gold buyers.

Ethereum pull in $169M as validators pile in to stake ETH

US spot Ethereum exchange-traded funds recorded $169 million in net inflows on Wednesday, marking the largest daily intake in two months, according to SoSoValue data. The rise in inflows signals renewed institutional interest in Ethereum amid broader market volatility.

The market compass is pointing at a barrel of Oil

The Asian open is arriving with equities leaning the wrong way, and the reason is not complicated. The market’s compass needle has snapped firmly toward crude. In this tape, oil is not just another input price; it is the gravitational center around which every asset class is orbiting.

Ripple tests recovery strength amid steady ETF inflows, growing retail interest

Ripple (XRP) continues to demonstrate notable resilience as the cryptocurrency market navigates the persistent war in the Middle East after the United States (US) and Israel attacked Iran on Saturday.