|

EUR/JPY Price Analysis: Bulls attack 100-DMA above 142.00

  • EUR/JPY buyers keep the reins at five-week high despite recent struggle to overcome 100-DMA.
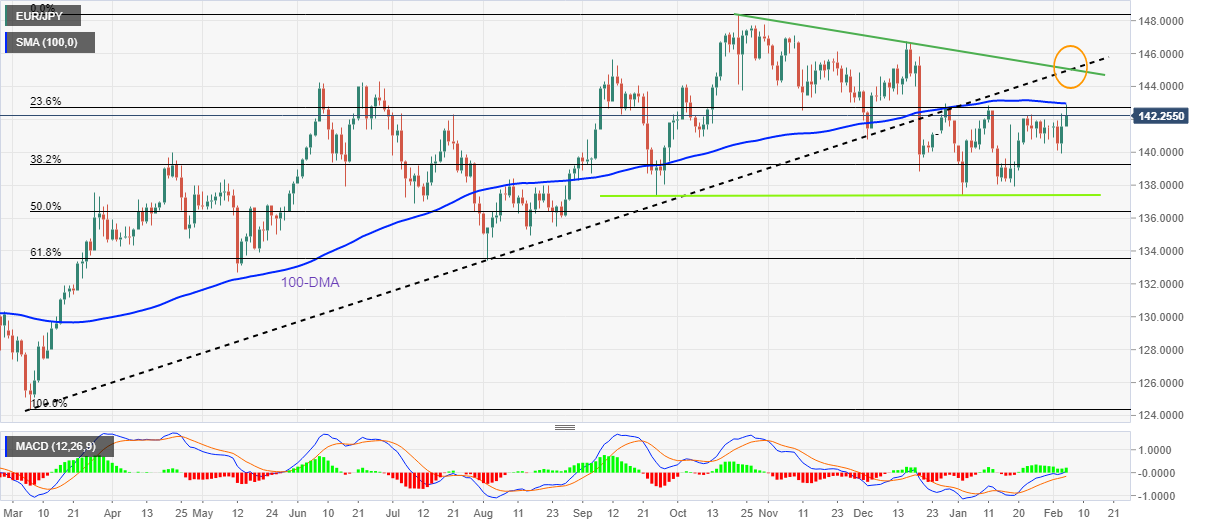
  • Bullish MACD signals, sustained rebound from multi-day-old horizontal support keeps buyers hopeful.
  • Convergence of previous support line from March, descending resistance line from late October appears crucial resistance.

EUR/JPY grinds higher past 142.00 as bulls struggle to cross the 100-DMA heading into Monday’s European session. In doing so, the cross-currency pair justifies the bullish MACD signals, as well as a clear bounce off a horizontal support line, stretched from late September 2022, to lure the pair buyers.

However, the 100-DMA challenges the EUR/JPY upside around the 143.00 threshold.

In the case where the EUR/JPY prices remain firmer past 143.00, a convergence of an 11-month-old previous support line and a downward-sloping resistance line from late October 2022, around 145.00, could challenge the pair’s further upside.

It’s worth noting that the EUR/JPY run-up beyond 145.00 won’t hesitate to challenge the late 2022 peak surrounding 148.40 while aiming for the 150.00 psychological magnet.

On the flip side, pullback moves may initially aim for the 140.00 round figure before testing the 38.2% Fibonacci retracement of the pair’s March-October 2022 upside, near 139.23.

Following that, the aforementioned horizontal support line comprising lows marked since late September 2022, near 137.35-30, will be in focus.

Even if the EUR/JPY bears conquer the 137.30 support, the 61.8% Fibonacci retracement level near 133.55 can act as the last defense of the buyers.

EUR/JPY: Daily chart

Trend: Limited upside expected

Additional important levels

Overview
Today last price142.28
Today Daily Change0.73
Today Daily Change %0.52%
Today daily open141.55
 
Trends
Daily SMA20140.78
Daily SMA50141.76
Daily SMA100142.98
Daily SMA200140.98
 
Levels
Previous Daily High142.34
Previous Daily Low139.93
Previous Weekly High142.34
Previous Weekly Low139.93
Previous Monthly High142.86
Previous Monthly Low137.39
Daily Fibonacci 38.2%141.42
Daily Fibonacci 61.8%140.85
Daily Pivot Point S1140.21
Daily Pivot Point S2138.86
Daily Pivot Point S3137.8
Daily Pivot Point R1142.62
Daily Pivot Point R2143.69
Daily Pivot Point R3145.03

Author

Anil Panchal

Anil Panchal

FXStreet

Anil Panchal has nearly 15 years of experience in tracking financial markets. With a keen interest in macroeconomics, Anil aptly tracks global news/updates and stays well-informed about the global financial moves and their implications.

More from Anil Panchal
Share:

Editor's Picks

EUR/USD: Cautiously optimistic near 1.1550 ahead of the ECB

EUR/USD extends its weekly recovery for the third day in a row on Wednesday, navigating in a sidelined fashion around 1.1550 on the back of humble losses in the US Dollar. In the meantime, market participants continue to closely follow developments in the Middle East while slowly gearing up for the ECB gathering on Thursday.

GBP/USD recedes from tops, hovers around 1.3400

GBP/USD could not sustain the initial bull run and is now slipping back toward the 1.3400 neighbourhood on Wednesday. Cable’s continuation of the ongoing leg higher follows mild selling pressure on the Greenback, despite steady uncertainty on the geopolitical front and elevated US inflation.

Gold bleeding continues as Middle East crisis escalates, Fed hike coming

Gold is accelerating its downward trends and approaches the area of $4,100 per troy ounce on Wednesday, where the 2026 bottom sits so far. The persistent decline in the precious metal almost exclusively follows the swelling opinion that the Fed will keep a cautious stance in H2, a view that was reinforced following earlier US CPI data.

$1,500: Why Ethereum just crashed 20% despite spot markets barely selling
Ethereum (ETH) recently suffered one of its sharpest declines of 2026, dropping more than 20% and briefly testing the $1,500 area. While the sell-off appeared to reflect broader market fears, derivatives and on-chain data suggest a more complex story may be unfolding beneath the surface.
Brutal sell-off: Silver deepens months-long slide, refocusing on $60

Silver has never been known for its calm temperament. The precious metal can spend weeks grinding higher before suddenly giving back months of gains in a matter of days. That volatile reputation has been on full display in recent weeks.

The US economy defies the rules: 100 days into the Oil shock and the recession signal is still missing

More than three months after the start of the Iran war and the resulting disruption to global energy markets, the US economy continues to display remarkable resilience. The conflict has triggered a sharp rise in Oil prices, reignited inflationary pressures and fueled widespread concerns about a potential economic slowdown.