|

EUR/JPY Price Analysis: Bullish forces steering the market, minor pullbacks possible

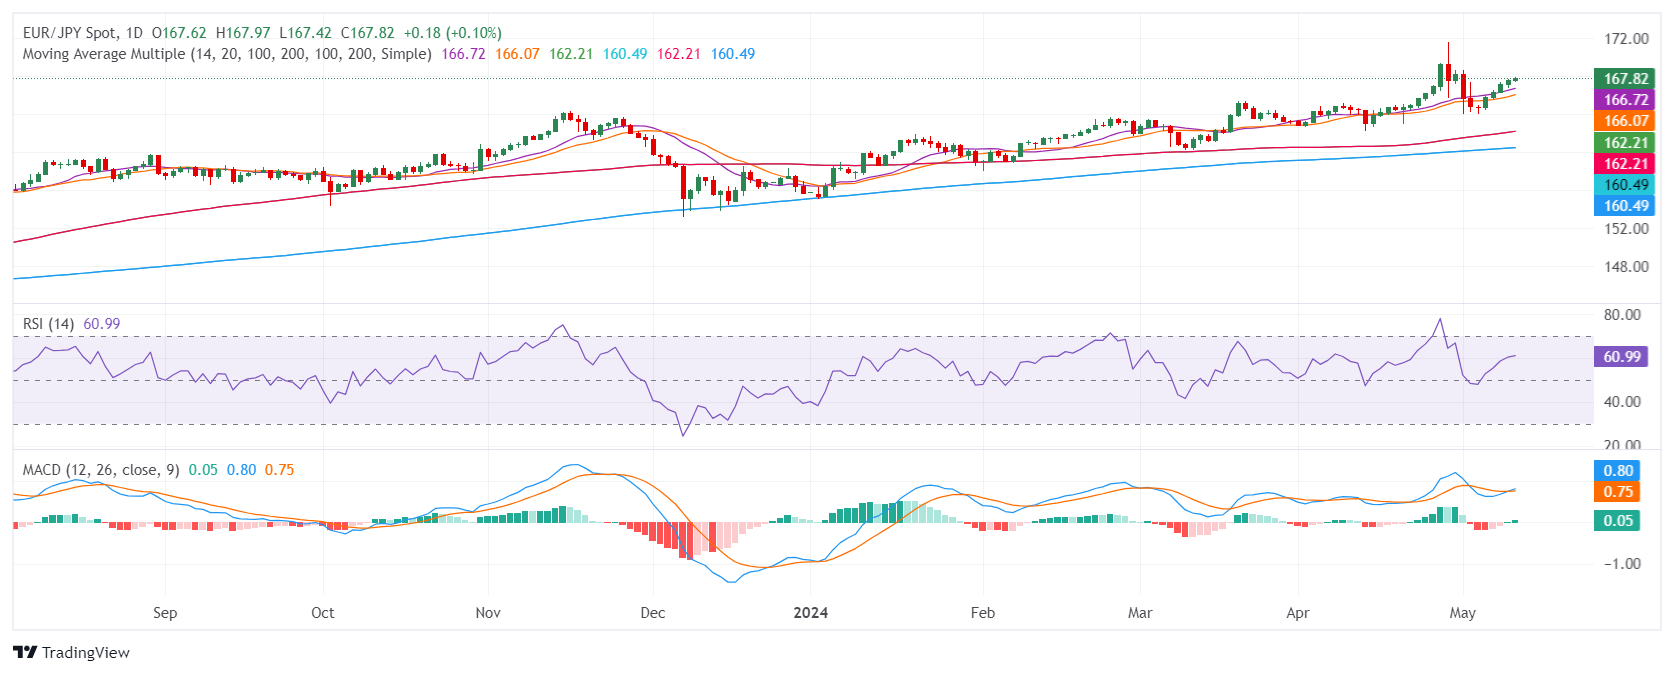
  • The daily EUR/JPY RSI reveals ongoing bullish momentum, demonstrating a stable shift from 44 to 60 in the last sessions.
  • Daily MACD perspectives align with the RSI, implying further progression of the positive momentum.
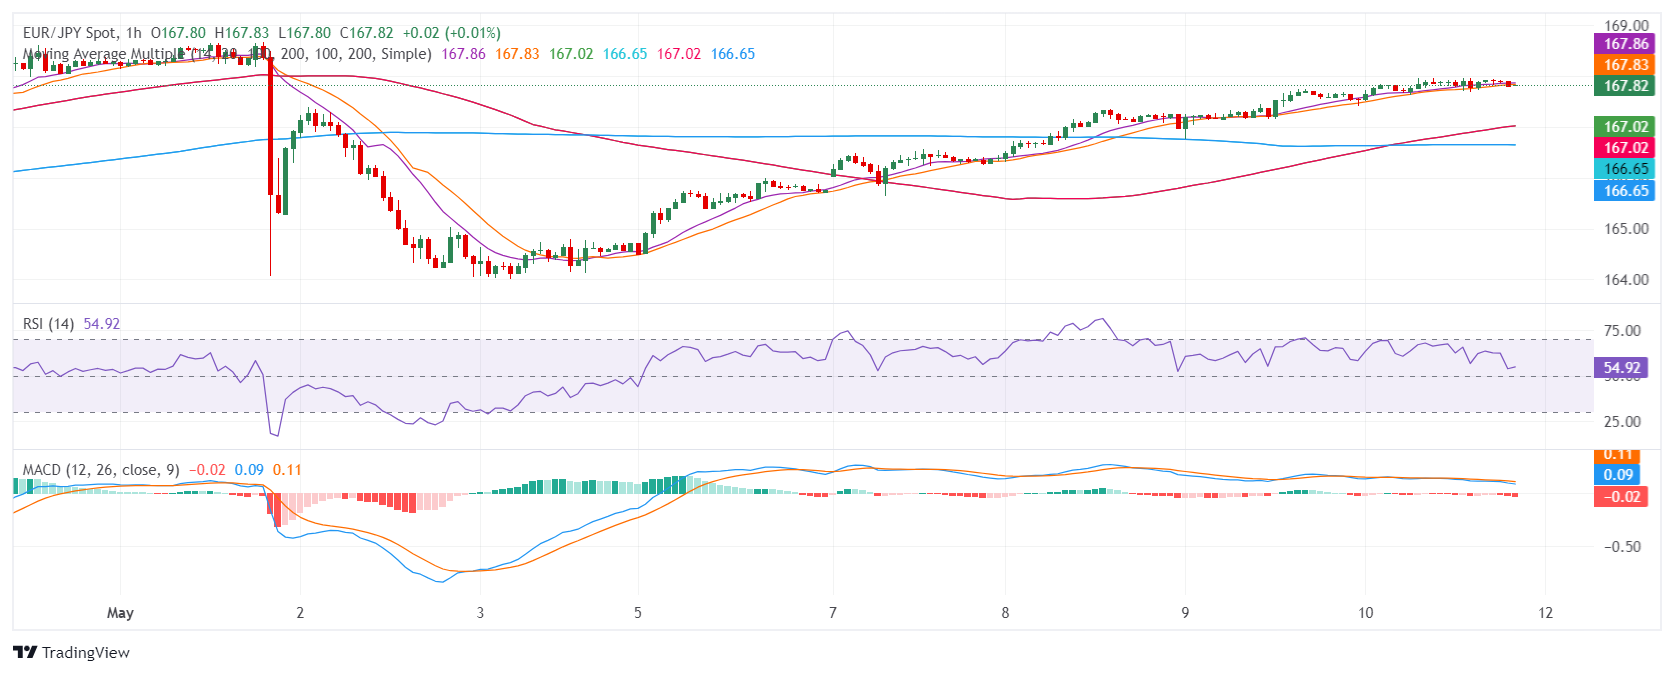
  • Hourly chart shows a dip in RSI to 53 and indicates rising sellers' traction, suggesting a temporary pause in ongoing bullish momentum.

The EUR/JPY has been dominating with a steady bullish trend. It rose to 167.85 on Friday, reflecting a positive momentum primarily driven by market buyers. However, short-term sellers seem to be upping their game, implying potential transient pullbacks as indicators are flashing overbought signals in the hourly chart.

On the daily chart, the Relative Strength Index (RSI) for the EUR/JPY. A stable increase from since last week 44 to the current reading of 60 reveals an ongoing bullish momentum, primarily driven by market buyers. The Moving Average Convergence Divergence (MACD) corresponds with this perspective by showcasing rising green bars, indicating that the positive momentum is further progressing.

EURJPY daily chart

Looking at the hourly chart, the RSI presents a slight pullback to 53.26 after peaking at 67.40. While this indicates a potential slowing of buying dominance, the MACD, emphasized by rising red bars, suggests the formation of negative momentum. Despite the noticeable shift in the hourly chart, the dominant daily bullish outlook remains unchanged.

EURJPY hourly chart

In assessing the bigger picture, the EUR/JPY is positioned above its Simple Moving Averages (SMA) for the 20, 100, and 200-day periods which suggests that the buyers are clearly in command.

EUR/JPY

Overview
Today last price167.8
Today Daily Change0.16
Today Daily Change %0.10
Today daily open167.64
 
Trends
Daily SMA20165.83
Daily SMA50164.28
Daily SMA100162.1
Daily SMA200160.43
 
Levels
Previous Daily High167.75
Previous Daily Low166.76
Previous Weekly High171.6
Previous Weekly Low164.02
Previous Monthly High171.6
Previous Monthly Low162.28
Daily Fibonacci 38.2%167.37
Daily Fibonacci 61.8%167.14
Daily Pivot Point S1167.02
Daily Pivot Point S2166.39
Daily Pivot Point S3166.03
Daily Pivot Point R1168.01
Daily Pivot Point R2168.37
Daily Pivot Point R3169

Author

Patricio Martín

Patricio is an economist from Argentina passionate about global finance and understanding the daily movements of the markets.

More from Patricio Martín
Share:

Markets move fast. We move first.

Orange Juice Newsletter brings you expert driven insights - not headlines. Every day on your inbox.

By subscribing you agree to our Terms and conditions.

Editor's Picks

EUR/USD moves sideways below 1.1800 on Christmas Eve

EUR/USD struggles to find direction and trades in a narrow channel below 1.1800 after posting gains for two consecutive days. Bond and stock markets in the US will open at the usual time and close early on Christmas Eve, allowing the trading action to remain subdued. 

GBP/USD keeps range around 1.3500 amid quiet markets

GBP/USD keeps its range trade intact at around 1.3500 on Wednesday. The Pound Sterling holds the upper hand over the US Dollar amid pre-Christmas light trading as traders move to the sidelines heading into the holiday season. 

Gold retreats from record highs, trades below $4,500

Gold retreats after setting a new record-high above $4,520 earlier in the day and trades in a tight range below $4,500 as trading volumes thin out ahead of the Christmas break. The US Dollar selling bias remains unabated on the back of dovish Fed expectations, which continues to act as a tailwind for the bullion amid persistent geopolitical risks.

Bitcoin slips below $87,000 as ETF outflows intensify, whale participation declines

Bitcoin price continues to trade around $86,770 on Wednesday, after failing to break above the $90,000 resistance. US-listed spot ETFs record an outflow of $188.64 million on Tuesday, marking the fourth consecutive day of withdrawals.

Economic outlook 2026-2027 in advanced countries: Solidity test

After a year marked by global economic resilience and ending on a note of optimism, 2026 looks promising and could be a year of solid economic performance. In our baseline scenario, we expect most of the supportive factors at work in 2025 to continue to play a role in 2026.

Avalanche struggles near $12 as Grayscale files updated form for ETF

Avalanche trades close to $12 by press time on Wednesday, extending the nearly 2% drop from the previous day. Grayscale filed an updated form to convert its Avalanche-focused Trust into an ETF with the US Securities and Exchange Commission.