|

EUR/JPY Price Analysis: Bounces off the 200-DMA, but sellers remain in control

  • The EUR/JPY rallied more than 150 pips and gained 0.25% on Tuesday.
  • A hammer in the EUR/JPY daily chart could open the door for further gains.
  • The cross faces solid resistance around 136.00-30 in the near term.

The EUR/JPY plunges to the 200-day EMA at 133.71, forms a hammer, and rallies above the August 1 daily close at 134.99, finishing the trading session at 135.37, as buyers regained control in a volatile session. As the Asian session begins, the EUR/JPY is trading at 135.20, almost flat.

EUR/JPY Price Analysis: Technical outlook

The EUR/JPY daily chart illustrates a hammer formed in the daily chart, right on the 200-day EMA. Nevertheless, the cross-currency closing below half of the August 1 price action exposes the pair to selling pressure. With the RSI sitting at negative territory, below the 7-day RSI’s SMA, and far from reaching the mid-line, it could keep the pair subject to market sentiment. If the EUR/JPY tumbles below 135.00, a re-test of the 200-day EMA could be possible due to the volatile price action in the last few days. On the other hand, the EUR/JPY upward moves could be capped at around 136.00.

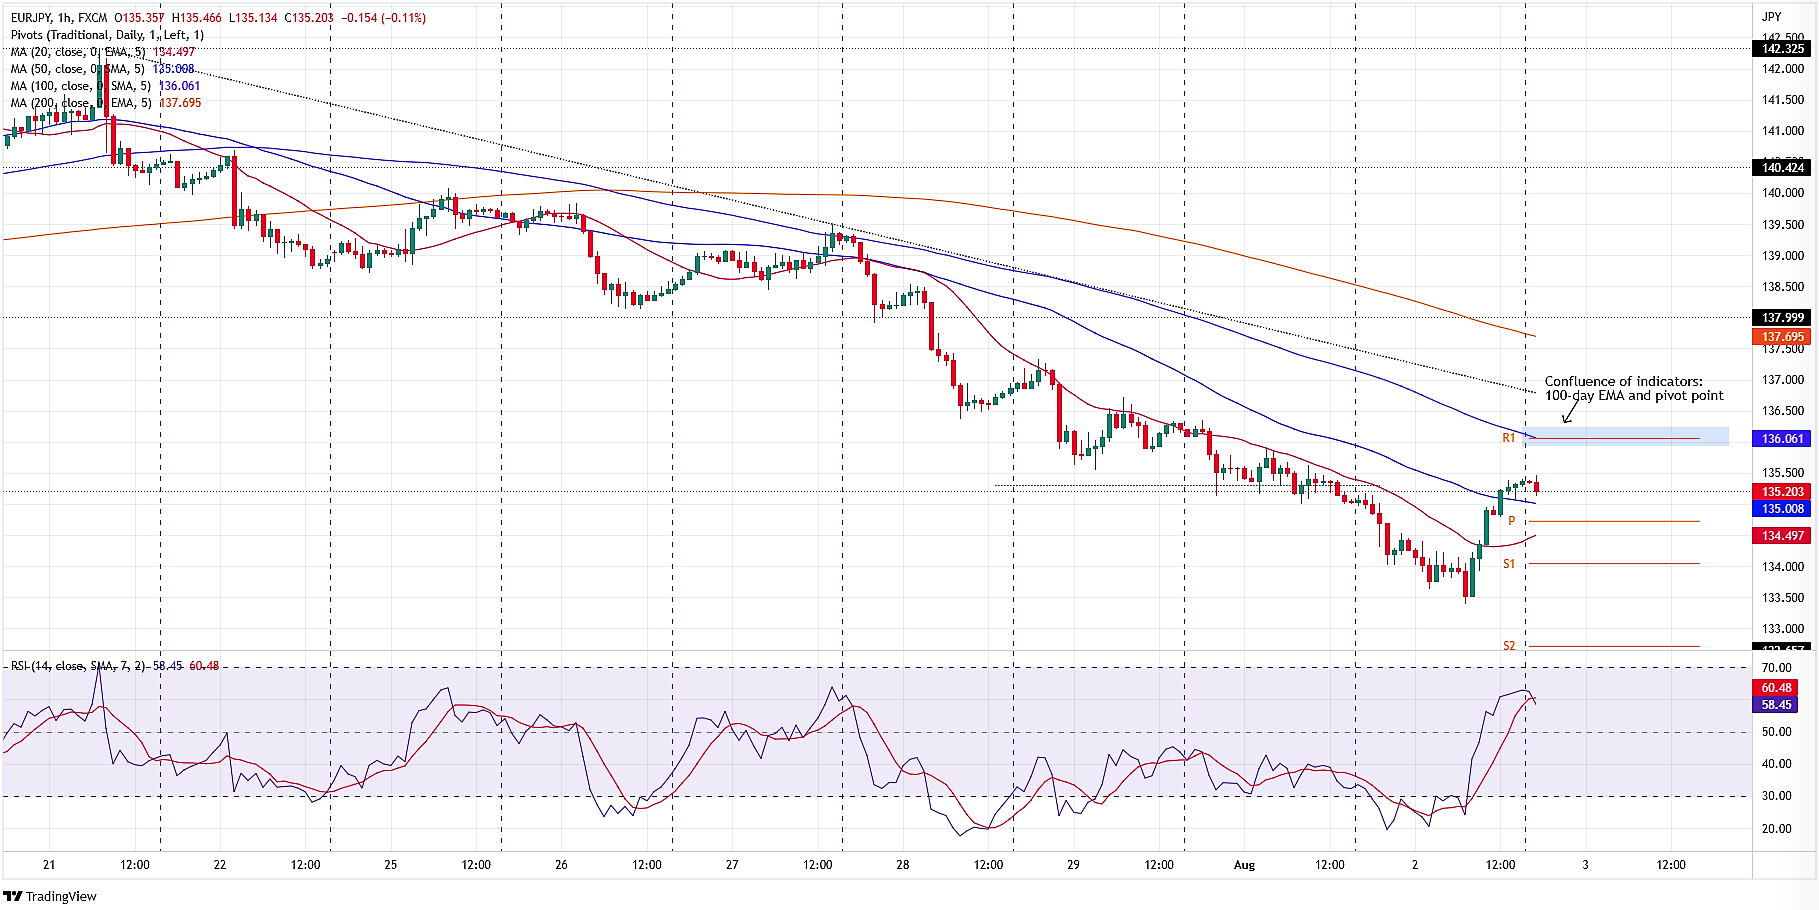
EUR/JPY 1-hour chart

In the near term, the EUR/JPY bias is neutral to downwards, though the cross-currency pair is trading above the 20 and 50-hour EMAs. However, the pair struggled to crack 135.50, with significant resistance above it, at the confluence of the R1 daily pivot and the 100-hour EMA at 136.06. Any rallies could be capped at the previously mentioned area, alongside the weekly high at 136.34. On the flip side, the EUR/JPY first support would be 135.00-05 area, followed by the daily pivot at 134.72.

EUR/JPY Key Technical Levels


Overview
Today last price135.20
Today Daily Change0.13
Today Daily Change %0.10
Today daily open135.06
 
Trends
Daily SMA20138.71
Daily SMA50139.89
Daily SMA100137.72
Daily SMA200133.72
 
Levels
Previous Daily High136.35
Previous Daily Low135
Previous Weekly High140.08
Previous Weekly Low135.55
Previous Monthly High142.43
Previous Monthly Low135.55
Daily Fibonacci 38.2%135.52
Daily Fibonacci 61.8%135.83
Daily Pivot Point S1134.59
Daily Pivot Point S2134.12
Daily Pivot Point S3133.25
Daily Pivot Point R1135.94
Daily Pivot Point R2136.82
Daily Pivot Point R3137.29

Author

Christian Borjon Valencia

Christian Borjon began his career as a retail trader in 2010, mainly focused on technical analysis and strategies around it. He started as a swing trader, as he used to work in another industry unrelated to the financial markets.

More from Christian Borjon Valencia
Share:

Markets move fast. We move first.

Orange Juice Newsletter brings you expert driven insights - not headlines. Every day on your inbox.

By subscribing you agree to our Terms and conditions.

Editor's Picks

EUR/USD holds steady near 1.1750 on first trading day of 2026

EUR/USD stays calm on Friday and trades in a narrow channel at around 1.1750 as trading conditions remain thin following the New Year holiday and ahead of the weekend. The economic calendar will not feature any high-impact data releases.

GBP/USD struggles to gain traction, stabilizes above 1.3450

After testing 1.3400 on the last day of 2025, GBP/USD managed to stage a rebound. Nevertheless, the pair finds it difficult to gather momentum and moves sideways above 1.3450 as market participants remain in holiday mood.

Gold climbs toward $4,400 following deep correction

Gold reverses its direction and advances toward $4,400 after suffering heavy losses amid profit-taking before the New Year holiday. Growing expectations for a dovish Fed policy and persistent geopolitical risks seem to be helping XAU/USD stretch higher.

Cardano gains early New Year momentum, bulls target falling wedge breakout

Cardano kicks off the New Year on a positive note and is extending gains, trading above $0.36 at the time of writing on Friday. Improving on-chain and derivatives data point to growing bullish interest, while the technical outlook keeps an upside breakout in focus.

Economic outlook 2026-2027 in advanced countries: Solidity test

After a year marked by global economic resilience and ending on a note of optimism, 2026 looks promising and could be a year of solid economic performance. In our baseline scenario, we expect most of the supportive factors at work in 2025 to continue to play a role in 2026.

Crypto market outlook for 2026

Year 2025 was volatile, as crypto often is.  Among positive catalysts were favourable regulatory changes in the U.S., rise of Digital Asset Treasuries (DAT), adoption of AI and tokenization of Real-World-Assets (RWA).