|

EUR/JPY Price Analysis: Bearish indications dominate and sellers consolidate below the 20-day SMA

  • The daily RSI and MACD reflect a negative trend, hinting at increasing selling pressure.
  • Hourly chart indicators echo the bearish sentiment, with RSI around the 40 level and MACD showing a lack of buying momentum.

The EUR/JPY pair declined to 164.72 on Friday, reflecting subtle bears' influence with daily losses. Despite bearish signals in the daily short-term outlook, the pair's positioning above the key Simple Moving Averages (SMAs) hints at ongoing dominance by the buyers.

The daily chart reveals that the Relative Strength Index (RSI) fell into negative territory. The Moving Average Convergence Divergence (MACD) also depicts a bearish momentum with a series of rising red bars, suggesting that sellers are currently dominating the market.

EUR/JPY daily chart

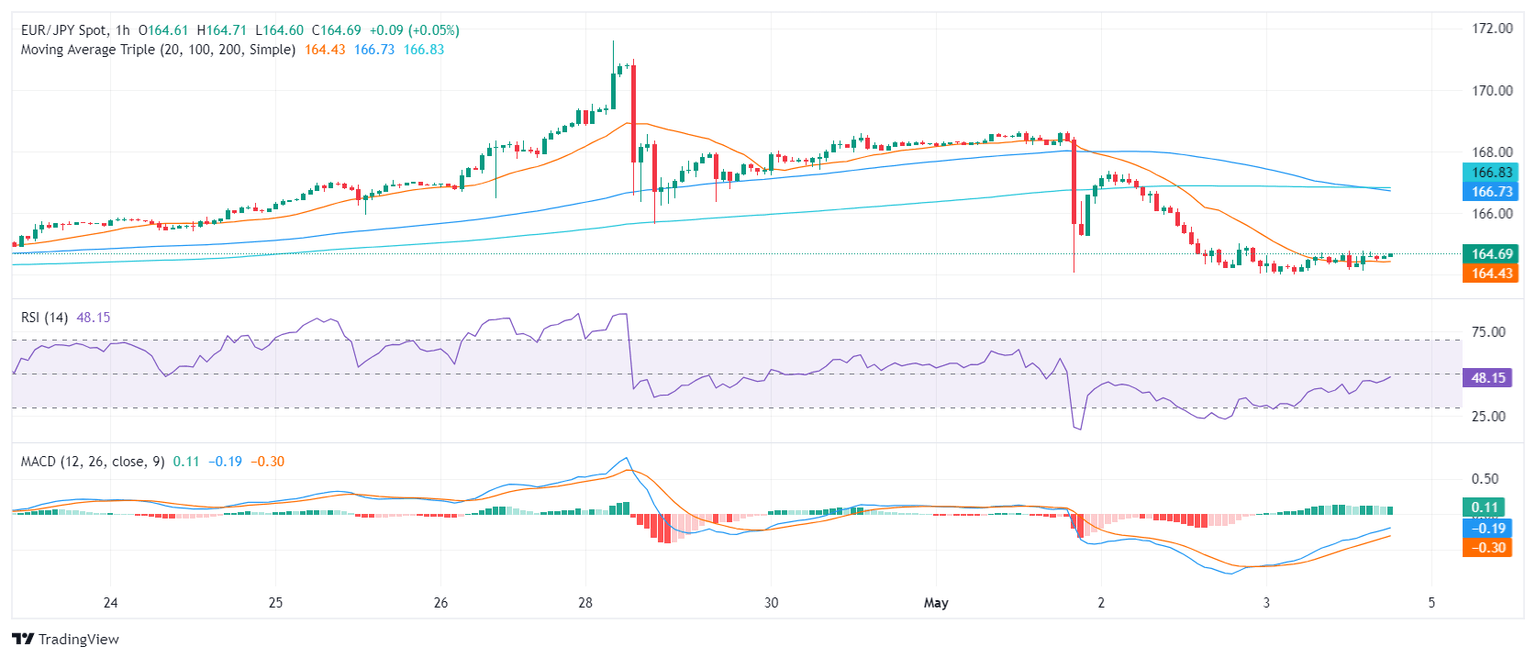
On the hourly chart, RSI continues to suggest a negative trend, hovering around the 40 levels, flirting with the oversold threshold, and showcasing the dominance of the sellers. The hourly MACD shows flat green bars, indicating a lack of strong momentum in these shorter time frames.

EUR/JPY hourly chart

Considering the overall market posture, the EUR/JPY is positioned above its longer-term Simple Moving Average (SMA) of 100, and 200-day periods. This usually signals a bullish momentum in both the medium and long term. However, the fall of the 20-day SMA means that the short-term outlook is painted with bearishness, and bears might attempt to reclaim the 100-day SMA at 161.70, which would definitely worsen the technical outlook in case of conquering.

EUR/JPY

Overview
Today last price164.67
Today Daily Change-0.16
Today Daily Change %-0.10
Today daily open164.83
 
Trends
Daily SMA20165.4
Daily SMA50163.95
Daily SMA100161.61
Daily SMA200160.18
 
Levels
Previous Daily High167.39
Previous Daily Low164.22
Previous Weekly High169.4
Previous Weekly Low164.4
Previous Monthly High171.6
Previous Monthly Low162.28
Daily Fibonacci 38.2%165.43
Daily Fibonacci 61.8%166.18
Daily Pivot Point S1163.57
Daily Pivot Point S2162.32
Daily Pivot Point S3160.41
Daily Pivot Point R1166.74
Daily Pivot Point R2168.64
Daily Pivot Point R3169.9

Author

Patricio Martín

Patricio is an economist from Argentina passionate about global finance and understanding the daily movements of the markets.

More from Patricio Martín
Share:

Editor's Picks

EUR/USD stays defensive below 1.1900 as USD recovers

EUR/USD trades in negative territory for the third consecutive day, below 1.1900 in the European session on Thursday. A modest rebound in the US Dollar is weighing on the pair, despite an upbeat market mood. Traders keep an eye on the US weekly Initial Jobless Claims data for further trading impetus. 

GBP/USD holds above 1.3600 after UK data dump

\GBP/USD moves little while holding above 1.3600 in the European session on Thursday, following the release of the UK Q4 preliminary GDP, which showed a 0.1% growth against a 0.2% increase expected. The UK industrial sector activity deteriorated in Decembert, keeping the downward pressure intact on the Pound Sterling. 

Gold sticks to modest intraday losses as reduced March Fed rate cut bets underpin USD

Gold languishes near the lower end of its daily range heading into the European session on Thursday. The precious metal, however, lacks follow-through selling amid mixed cues and currently trades above the $5,050 level, well within striking distance of a nearly two-week low touched the previous day.

Cardano eyes short-term rebound as derivatives sentiment improves

Cardano (ADA) is trading at $0.257 at the time of writing on Thursday, after slipping more than 4% so far this week. Derivatives sentiment improves as ADA’s funding rates turn positive alongside rising long bets among traders.

A tale of two labour markets: Headline strength masks underlying weakness

Undoubtedly, yesterday’s delayed US January jobs report delivered a strong headline – one that surpassed most estimates. However, optimism quickly faded amid sobering benchmark revisions.

Sonic Labs’ vertical integration fuels recovery in S token

Sonic, previously Fantom (FTM), is extending its recovery trade at $0.048 at the time of writing, after rebounding by over 12% the previous day. The recovery thesis’ strengths lie in the optimism surrounding Sonic Labs’ Wednesday announcement to shift to a vertically integrated model, aimed at boosting S token utility.