EUR/GBP weakens as Eurozone inflation holds steady, UK PMI stabilizes
- Eurozone inflation rose 2.2% YoY in September, core HICP steady at 2.3%, both aligned with economists’ forecasts.
- Eurozone manufacturing PMI falls to 49.8, back into contraction zone, while UK factory PMI held unchanged at 46.2.
- UK GDP stagnated in Q2, with households under inflation pressure and tax hike risks weighing on Sterling outlook.

EUR/GBP drops during the North American session on Wednesday after the latest release of inflation in the Eurozone came in line with estimates, but slightly above the European Central Bank's (ECB) goal. The cross trades around 0.8696, down 0.36%.
Cross falls despite Eurozone CPI holding above ECB’s target and business activity showing signs of recovery
The Eurozone reported that inflation rose by 2.2% YoY in September, aligned with estimates but above August's 2% print. Excluding volatile items, the so-called core Harmonized Index of Consumer Prices (HICP) for the bloc was steady at 2.3% YoY, as foreseen.
Other data revealed that business activity in the Eurozone worsened, with the HCOB Manufacturing PMI declining from 50.7 to 49.8 in September, getting into contraction territory.
In the UK, the S&P Global Manufacturing PMI contracted in September, but it appears to have stabilized after remaining unchanged at 46.2, as it was in August.
On Tuesday, traders digested the release of Gross Domestic Product (GDP) figures for the UK, which showed the economy stagnated in Q2. In the meantime, British households are facing high inflation, and a possible tax increase by Finance Minister Rachel Reeves would put pressure on the British Pound.
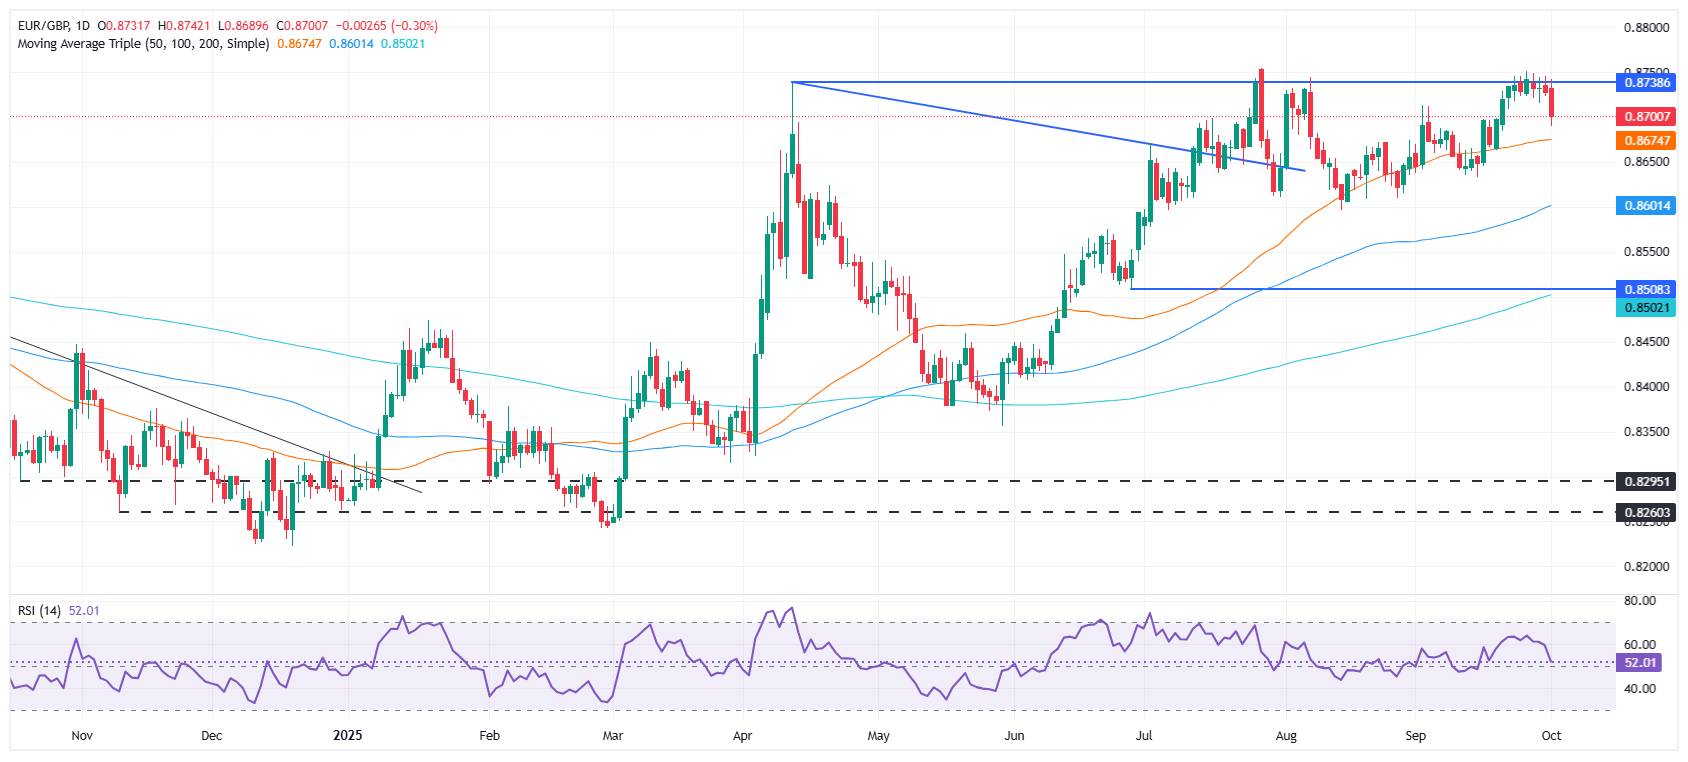
EUR/GBP Price Forecast: Consolidates around 0.8700
EUR/GBP seems to have peaked as depicted by the technical picture, although it retreated, bounced off a key support level at the 20-day Simple Moving Average (SMA) at 0.8694, which drove the pair above 0.8700.
Momentum indicates that sellers are in charge, but the Relative Strength Index (RSI) remains above its neutral level, suggesting that buyers are stepping in.
If the cross ends on a daily basis above 0.8700, buyers could test the daily high of 0.8742. Key resistance levels lie overhead, like the yearly peak at 0.8757 and 0.8800. On the other hand, the first support is the 20-day SMA at 0.8694, followed by the 50-day SMA at 0.5674.
(This story was corrected on October 1 at 16:59 GMT to say that the Eurozone HCOB Manufacturing PMI declined to 49.8 in September, it did not rise to 49.5.)
Euro Price Last 30 days
The table below shows the percentage change of Euro (EUR) against listed major currencies last 30 days. Euro was the strongest against the Canadian Dollar.
| USD | EUR | GBP | JPY | CAD | AUD | NZD | CHF | |
|---|---|---|---|---|---|---|---|---|
| USD | -0.28% | 0.11% | 0.07% | 1.55% | -0.88% | 1.34% | -0.21% | |
| EUR | 0.28% | 0.39% | 0.29% | 1.83% | -0.61% | 1.62% | 0.08% | |
| GBP | -0.11% | -0.39% | -0.22% | 1.44% | -0.99% | 1.23% | -0.26% | |
| JPY | -0.07% | -0.29% | 0.22% | 1.55% | -0.95% | 1.30% | -0.25% | |
| CAD | -1.55% | -1.83% | -1.44% | -1.55% | -2.39% | -0.20% | -1.67% | |
| AUD | 0.88% | 0.61% | 0.99% | 0.95% | 2.39% | 2.25% | 0.73% | |
| NZD | -1.34% | -1.62% | -1.23% | -1.30% | 0.20% | -2.25% | -1.48% | |
| CHF | 0.21% | -0.08% | 0.26% | 0.25% | 1.67% | -0.73% | 1.48% |
The heat map shows percentage changes of major currencies against each other. The base currency is picked from the left column, while the quote currency is picked from the top row. For example, if you pick the Euro from the left column and move along the horizontal line to the US Dollar, the percentage change displayed in the box will represent EUR (base)/USD (quote).
Author

Christian Borjon Valencia
FXStreet
Markets analyst, news editor, and trading instructor with over 14 years of experience across FX, commodities, US equity indices, and global macro markets.


