|

EUR/GBP technical analysis: Mixed play of short-term ascending channel, overbought RSI

  • 10-day long ascending trend channel and refrain from declining portrays the upside momentum strength.
  • 200-day SMA seems to be the next landmark.

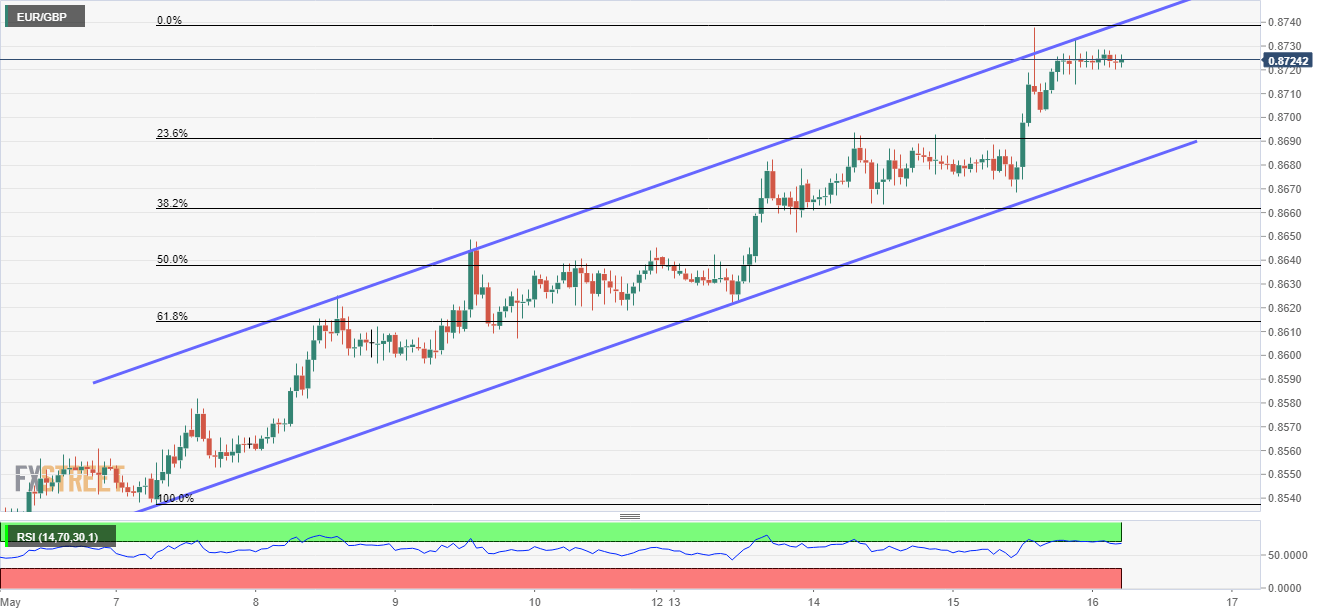
Even if overbought levels of 14-bar relative strength index (RSI) question buyers, EUR/GBP remains strong around 0.8725 during early Thursday.

Not only pair’s refrain from declining beneath 0.8720 but a 10-day long ascending trend channel also portrays its strength towards targeting the channel resistance of 0.8740 on the break of 0.8725 immediate upside barrier.

It should also be noted that quote’s rise past 0.8740 could challenge the 200-day simple moving average (SMA) level on the daily chart at 0.8795 now.

Meanwhile, 0.8715 and channel support of 0.8680 seem nearby important supports ahead of 0.8650 and 0.8615 rest-points.

Moreover, pair’s extended downturn below 0.8615 might not hesitate to visit 0.8540 support level comprising May 07 low.

EUR/GBP hourly chart

Trend: Positive

Additional important levels

Overview
Today last price0.8724
Today Daily Change2 pips
Today Daily Change %0.02%
Today daily open0.8722
 
Trends
Daily SMA200.8626
Daily SMA500.8603
Daily SMA1000.8696
Daily SMA2000.8797
Levels
Previous Daily High0.8738
Previous Daily Low0.8668
Previous Weekly High0.8649
Previous Weekly Low0.8489
Previous Monthly High0.8685
Previous Monthly Low0.8502
Daily Fibonacci 38.2%0.8711
Daily Fibonacci 61.8%0.8695
Daily Pivot Point S10.8681
Daily Pivot Point S20.864
Daily Pivot Point S30.8612
Daily Pivot Point R10.8751
Daily Pivot Point R20.8779
Daily Pivot Point R30.882

Author

Anil Panchal

Anil Panchal

FXStreet

Anil Panchal has nearly 15 years of experience in tracking financial markets. With a keen interest in macroeconomics, Anil aptly tracks global news/updates and stays well-informed about the global financial moves and their implications.

More from Anil Panchal
Share:

Editor's Picks

EUR/USD hovers around nine-day EMA above 1.1800

EUR/USD gains ground for the second successive session, trading around 1.1820 during the Asian hours on Monday. The 14-day Relative Strength Index momentum indicator stands at 51 (neutral) after recovering above the midline, indicating stabilizing momentum. 

GBP/USD gathers strength above 1.3500 amid tariff confusion

The GBP/USD pair gains traction to around 1.3520 during the early Asian session on Monday. The US Dollar faces some selling pressure against the Cable as tariff uncertainty lingers. Traders will take more cues from the US Producer Price Index report for January, which will be published later on Friday. 

Gold climbs to fresh monthly high on trade war fears, geopolitical risks, weaker USD

Gold registered its highest-ever weekly close, above the $5,100 mark on Friday, and gains strong follow-through traction at the start of a new week. This also marks the fourth straight day of a positive move and lifts the commodity beyond the $5,150 level, or a fresh monthly peak, during the Asian session. 

Cardano braces for impact as US tariff storm brews

Cardano is down 4% at press time on Monday, entering its third consecutive day of decline. Bearish bias in Cardano’s derivatives market positional buildup aligns with rising pressure on the broader cryptocurrencymarket amid US President Donald Trump's reassessment of global tariffs and domestic conflict with the US Supreme Court. 

Liberation day take two, the tariff machine just changed gears

Let me caveat this from the outset. What we are watching is first-order mechanics, not the grand macro endgame. This is the market’s immediate reflex to a 15% Trump tariff levy dressed up as judicial drama. The Supreme Court blocked Trump tarrif hammer. The White House came back with a scalpel.

Top Crypto Losers: Zcash, Pump.fun, and LayerZero extended losses as Bitcoin loses $65,000

The cryptocurrency market starts the week in panic mode, with altcoins Zcash, Pump.fun, and LayerZero. Bitcoin falls below $65,000 as the US President Donald Trump regroups amid renewed trade policy risks.