|

EUR/GBP technical analysis: Euro losing steam below 0.9300 against Sterling

  • EUR/GBP is retracing below the 0.9300 figure. 
  • The pullback down can extend towards 0.9245 and 0.9230 levels in the short term.
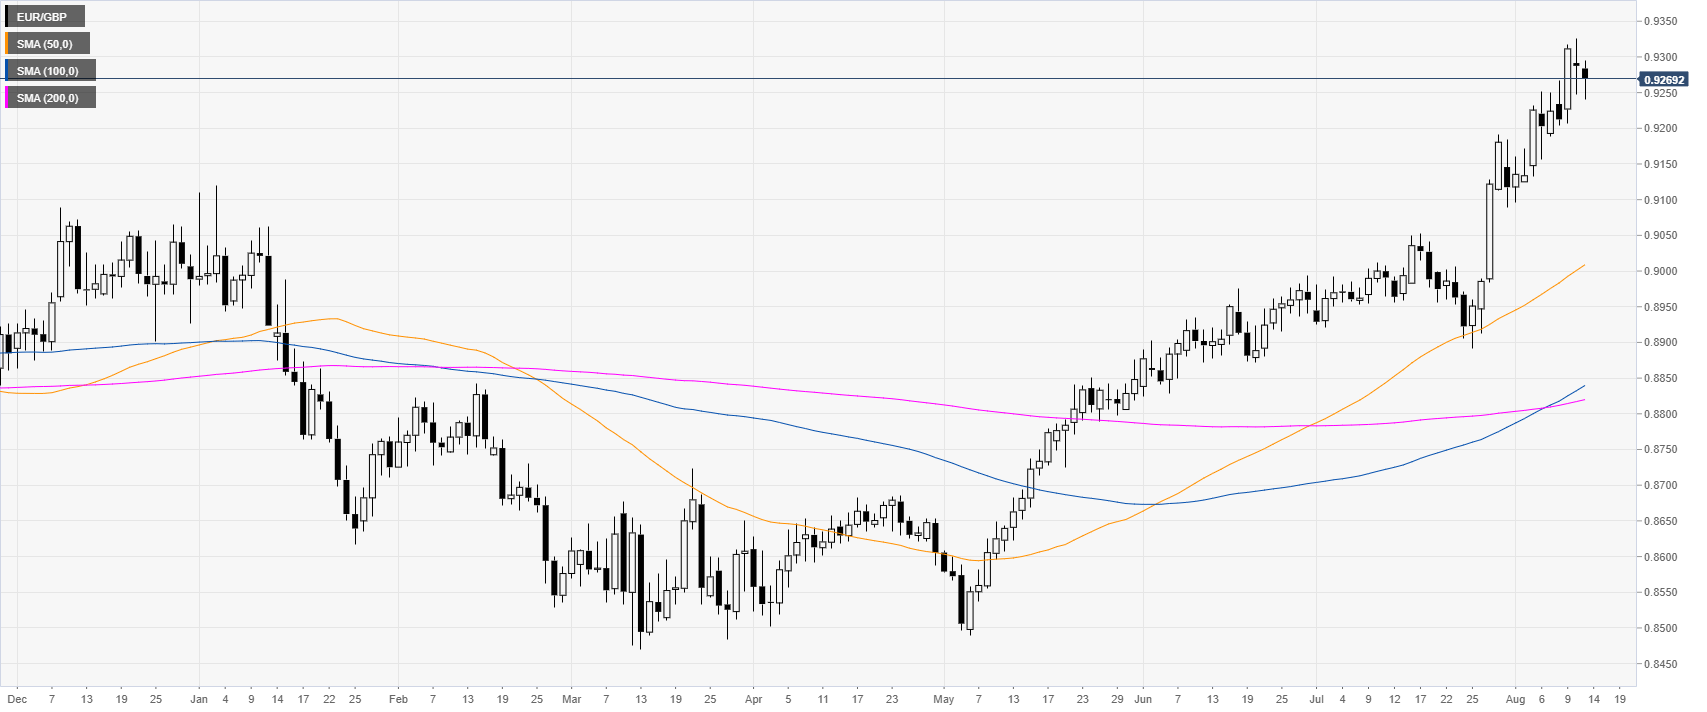
 

EUR/GBP daily chart

 
EUR/GBP is retracing down after reaching a new 2019 high on Monday at 0.9326. The market almost reached the August 29, 2017 high at the 0.9307 level. 
 

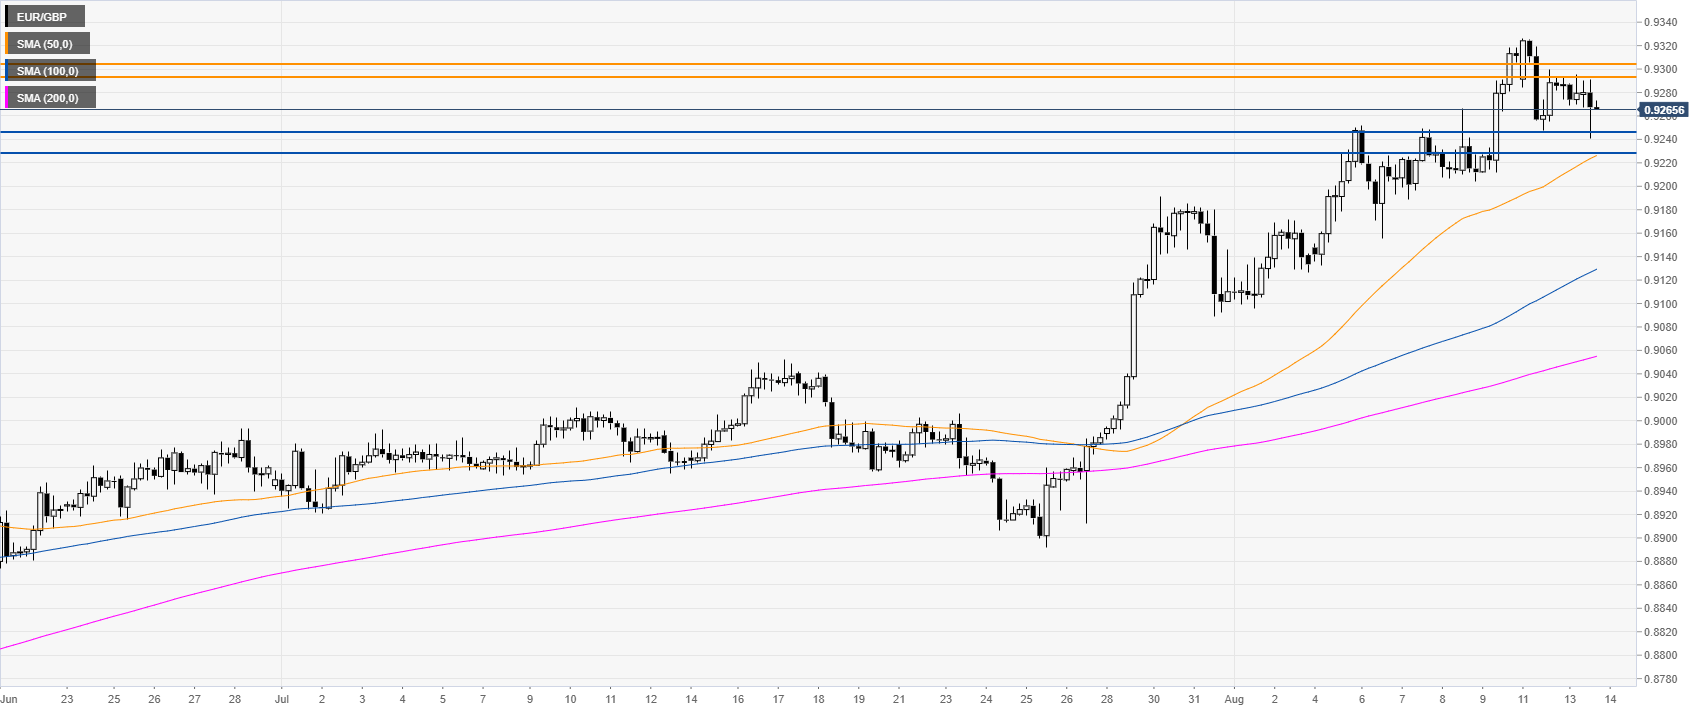
EUR/GBP 4-hour chart


EUR/GBP is trading above its primary SMAs, suggesting bullish momentum in the near term. Bulls want to break above 0.9305 to reach 0.9371 on the way up, according to the Technical Confluences Indicator. However, this scenario seems to be less likely as the market is losing momentum.


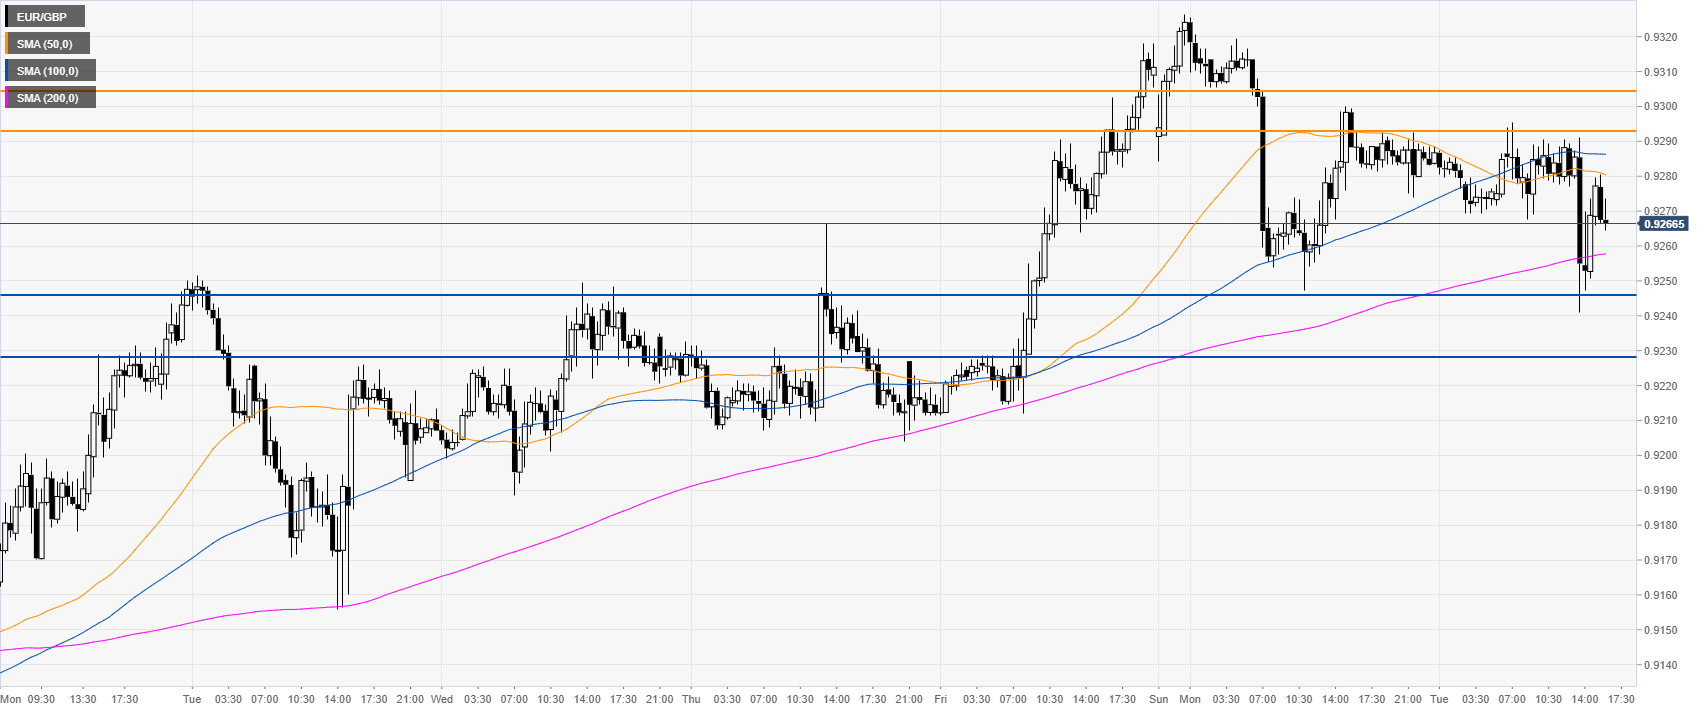
EUR/GBP 30-minute chart

 
EUR/GBP is pulling back down below the 0.9230 resistance and the 50/100 SMA. The retracement could find potential supports at 0.9245 and the 0.9230 level, according to the Technical Confluences Indicator.


Additional key levels

EUR/GBP

Overview
Today last price0.9268
Today Daily Change-0.0020
Today Daily Change %-0.22
Today daily open0.9288
 
Trends
Daily SMA200.9099
Daily SMA500.9001
Daily SMA1000.8832
Daily SMA2000.8817
Levels
Previous Daily High0.9326
Previous Daily Low0.9247
Previous Weekly High0.9318
Previous Weekly Low0.9132
Previous Monthly High0.9192
Previous Monthly Low0.8892
Daily Fibonacci 38.2%0.9278
Daily Fibonacci 61.8%0.9296
Daily Pivot Point S10.9248
Daily Pivot Point S20.9208
Daily Pivot Point S30.9169
Daily Pivot Point R10.9327
Daily Pivot Point R20.9366
Daily Pivot Point R30.9406

Author

Flavio Tosti

Flavio Tosti

Independent Analyst


More from Flavio Tosti
Share:

Editor's Picks

EUR/USD remains heavy near 1.1600 after hot EU inflation data

EUR/USD remains heavily offered near 1.1600, six-week lows, in the European session on Tuesday. The pair fails to find any inspiration from a surprise pick up in Eurozone inflation for February, as the US Dollar continues to attract safe haven flows amid escalating geopolitical tensions in the Middle East. 

GBP/USD attacks 1.3300, refreshing three-month lows

GBP/USD is deep in the red near 1.3300, accelerating its downside to renew three-month lows in European trading on Tuesday. The ongoing escalation in the Iran war, combined with rising Oil prices, weighs negatively on the higher-yielding Pound Sterling as the US Dollar capitalizes on increased haven demand.

Gold falls below $5,300 as stronger USD counter Middle East woes

Gold attracts some intraday selling and falls below $5,300 on Tuesday. The US Dollar climbs to a fresh high since January 20 and turns out to be a key factor exerting downward pressure on the commodity. However, concerns about a broader regional conflict in the Middle East continue to weigh on investors' sentiment and underpin demand for the traditional safe-haven bullion.

Stellar risks deeper losses as derivatives metrics turn negative

Stellar is trading red below $0.16 at the time of writing on Tuesday, after a slight recovery the previous day. Weakening derivatives data caps the recovery, while an unfavorable technical outlook projects a deeper correction for the XLM token in the upcoming days.

Middle East conflict ramps up a gear as energy price spike rips through markets

It’s another risk off day as geopolitical headwinds continue to batter financial markets. Although markets calmed during the US session and US stocks managed to post gains on Monday, this has not fed through to the European session, and stocks and bonds are sharply lower for a second day.

Hyperliquid Price Forecast: HYPE rises on commodities demand amid US-Iran war

Hyperliquid (HYPE) steadies above $33 at press time on Tuesday, marking its fourth consecutive day of recovery in a broadly volatile market due to the ongoing US-Israel strikes on Iran.