|

EUR/GBP Technical Analysis: Euro hanging at monthly highs against GBP above 0.8650 level
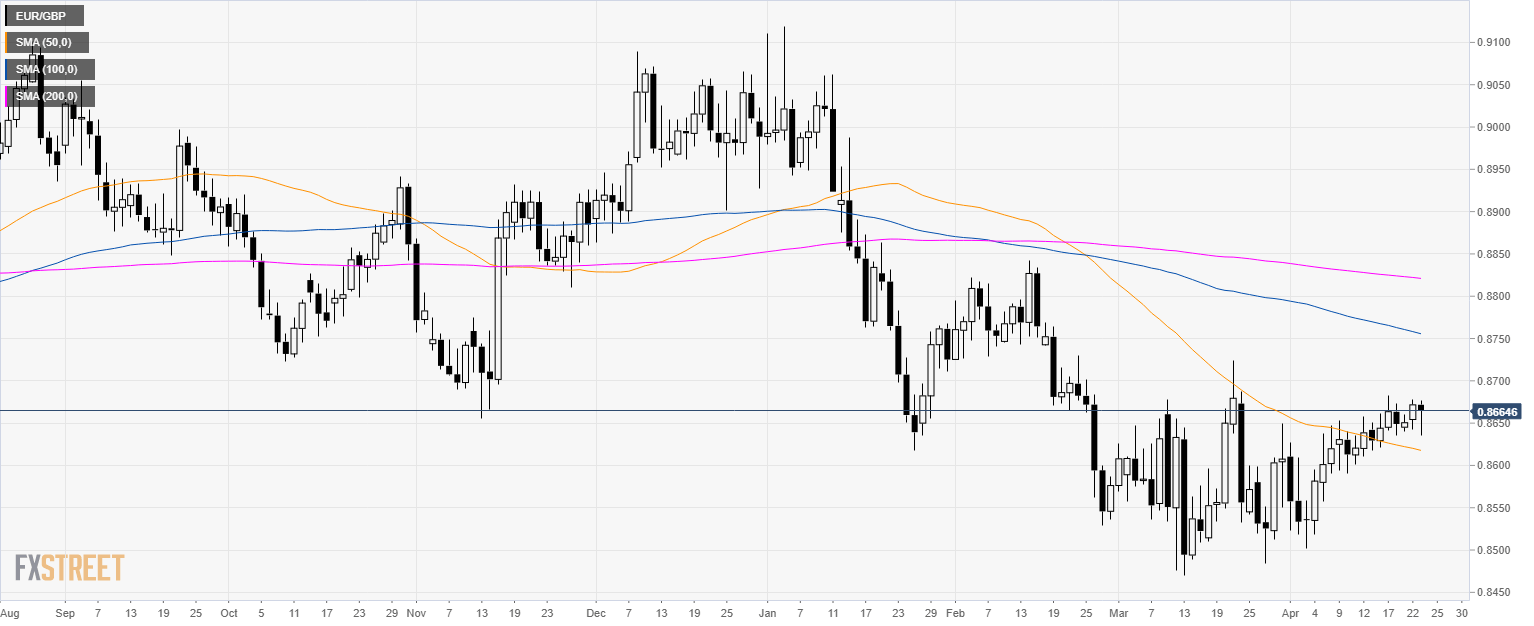
EUR/GBP daily

  • EUR/GBP is evolving in a bear trend below its 100 and 200 simple moving averages (SMAs).
  • EUR/GBP is getting near the 0.8700 figure as the market is trading above its 50 SMA.

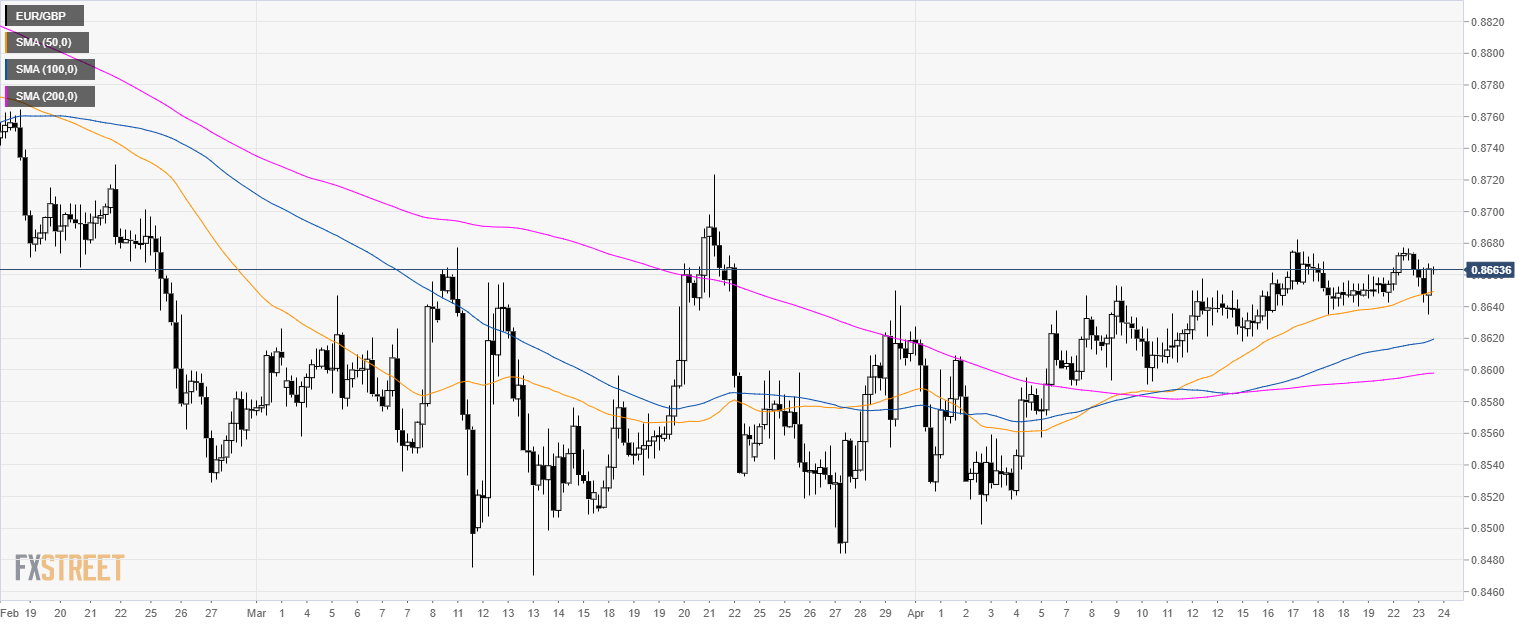
EUR/GBP 4-hour chart
  • EUR/GBP is trading above its main SMAs suggesting bullish momentum.

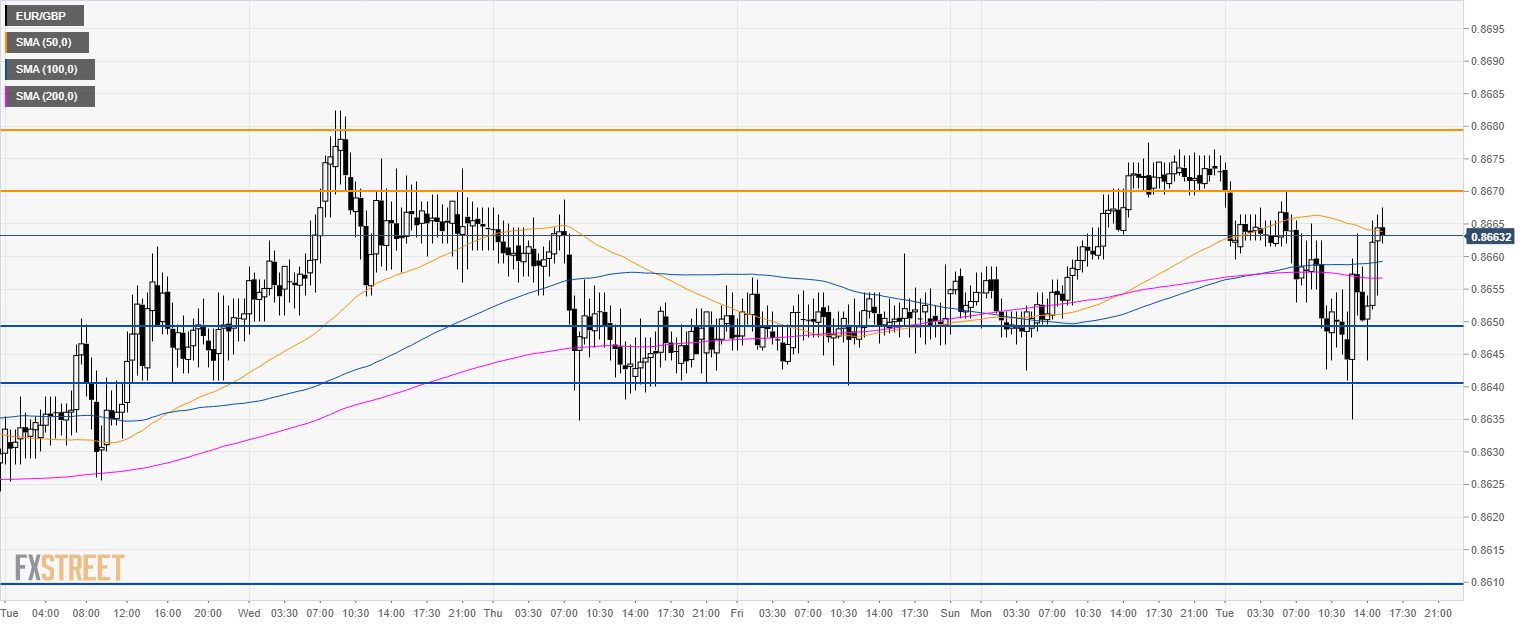
EUR/GBP 30-minute chart

  • EUR/GBP has found resistance near 0.8670. However, a break above 0.8680 is necessary for bulls to move up towards 0.8700 figure and 0.8770 resistance.
  • To the downside, the market should continue to find some support near 0.8650/40 and 0.8610 level.

Additional key levels

EUR/GBP

Overview
Today last price0.8664
Today Daily Change-0.0008
Today Daily Change %-0.09
Today daily open0.8672
 
Trends
Daily SMA200.8605
Daily SMA500.862
Daily SMA1000.8758
Daily SMA2000.8822
Levels
Previous Daily High0.8678
Previous Daily Low0.8642
Previous Weekly High0.8682
Previous Weekly Low0.8618
Previous Monthly High0.8724
Previous Monthly Low0.847
Daily Fibonacci 38.2%0.8664
Daily Fibonacci 61.8%0.8656
Daily Pivot Point S10.865
Daily Pivot Point S20.8629
Daily Pivot Point S30.8615
Daily Pivot Point R10.8685
Daily Pivot Point R20.8699
Daily Pivot Point R30.872

Author

Flavio Tosti

Flavio Tosti

Independent Analyst


More from Flavio Tosti
Share:

Editor's Picks

EUR/USD seems fragile below 1.1700 as Middle East war boosts energy prices

The EUR/USD pair trades flat at around 1.1680 during the Asian trading session on Tuesday, but broadly seems vulnerable, being close to its five-week low. The major currency pair is under pressure as surging oil prices due to the United States-Israel war with Iran have increased the risks of higher inflation for the Old Continent.

GBP/USD hovers around 1.3400 with bearish pressure intact

GBP/USD edges higher after three days of losses, trading around 1.3400 during the Asian hours on Tuesday. The technical analysis of the daily chart indicates an ongoing bearish bias, as the pair trades within a descending channel pattern.

Gold sticks to gains above $5,350 amid sustained safe-haven demand; firmer USD caps gains

Gold sticks to its positive bias for the third straight day and trades above the $5,350 level heading into the European session on Tuesday. Concerns about a broader regional conflict in the Middle East continue to weigh on investors' sentiment and underpin demand for the traditional safe-haven bullion.

Stellar risks deeper losses as derivatives metrics turn negative

Stellar is trading red below $0.16 at the time of writing on Tuesday, after a slight recovery the previous day. Weakening derivatives data caps the recovery, while an unfavorable technical outlook projects a deeper correction for the XLM token in the upcoming days.

The market is not panicking it is repricing the probability distribution of Oil and time

At the end of the day, markets do not trade morality or geopolitics. They trade transmission channels. And the only channel that truly matters in this maelstrom runs through the price of energy and the time value of money.

Grass 20% bullish breakout defies broader market weakness

Grass (GRASS) is edging up above $0.30 at the time of writing on Monday. The token’s notable 20% intraday surge stands out amid heightened volatility in the broader crypto market.