EUR/GBP technical analysis: 21-day EMA, 0.8724/25 limit short-term recovery
- EUR/GBP marks repeated reversals from a multi-month old rising support line amid oversold RSI conditions.
- 61.8% Fibonacci retracement adds to the resistances.

The EUR/GBP pair’s repeated bounces off an upward sloping trend line since mid-March isn’t speaking loudly for the quote’s strength as multiple key resistances lie untouched. The pair traders around 0.86353 by the press time of the pre-European session on Monday.
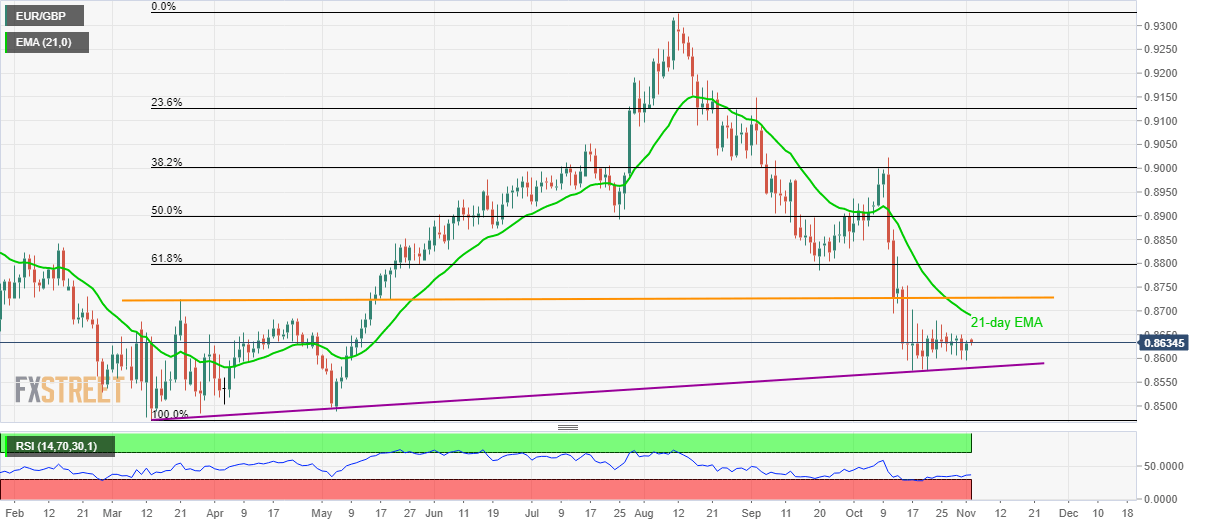
With the oversold conditions of 14-day Relative Strength Index (RSI) favoring the pair’s recovery, 21-day Exponential Moving Average (EMA) level of 0.8690 and a horizontal area including March month high and late-May low, around 0.8725, questions the buyers.
Additionally, 61.8% Fibonacci retracement of March-August upside, at 0.8800, adds to resistances, a break of which could propel prices to 0.8870 numbers to the north.
Meanwhile, a downside break of 0.8580 support line can avail 0.8500 as an intermediate halt prior to revisiting March month low near 0.8470.
EUR/GBP daily chart
Trend: sideways
Author

Anil Panchal
FXStreet
Anil Panchal has nearly 15 years of experience in tracking financial markets. With a keen interest in macroeconomics, Anil aptly tracks global news/updates and stays well-informed about the global financial moves and their implications.


