EUR/GBP sees meager rebound from 0.8560 as Euro gets a reprieve from selling pressure
- The EUR/GBP is moderately up on Monday, climbing 0.2%.
- The Euro is catching a breather after two weeks of accelerated declines against the Pound Sterling.
- A dovish ECB is doing the Euro few favors, midweek to bring EU Retail Sales figures.

The EUR/GBP is seeing a welcome break from ongoing Euro (EUR) selling, rebounding a modest two-tenths of a percent against the Pound Sterling (GBP) on Monday.
The EUR/GBP remains mostly flat on the day, with the majority of the pair’s gains coming at the very start of the new trading week’s opening session, but any news is good news for the Euro which has seen two weeks of rapid declines against the Pound Sterling.
Monday saw the Eurozone’s December Sentix Investor Confidence Index recover less than investors expected, with indexed investor outlook printing -16.8, down from the forecast -14.4, but still an improvement from November’s Sentix Investor Confidence read of -18.6.
ECB talking points, EU Retail Sales to drive the Euro-Pound Sterling pair
The European Central Bank (ECB) has settled into a repetitive speech cycle recently, noting that inflation continues to decline within the Eurozone, and markets have seen a discount applied to the Euro as investors remain skeptical that the ECB will be able to achieve a desirable rate of price growth within a reasonable timeframe, with the ECB hoping for inflation to cool to 2% sooner rather than later.
Wednesday will see October’s Eurozone Retail Sales, and the annualized headline is expected to come in at -0.9% compared to September’s -2.9%. The MoM figure for October is forecast to see a slight improvement from -0.3% to 0.2%.
EUR/GBP Technical Outlook
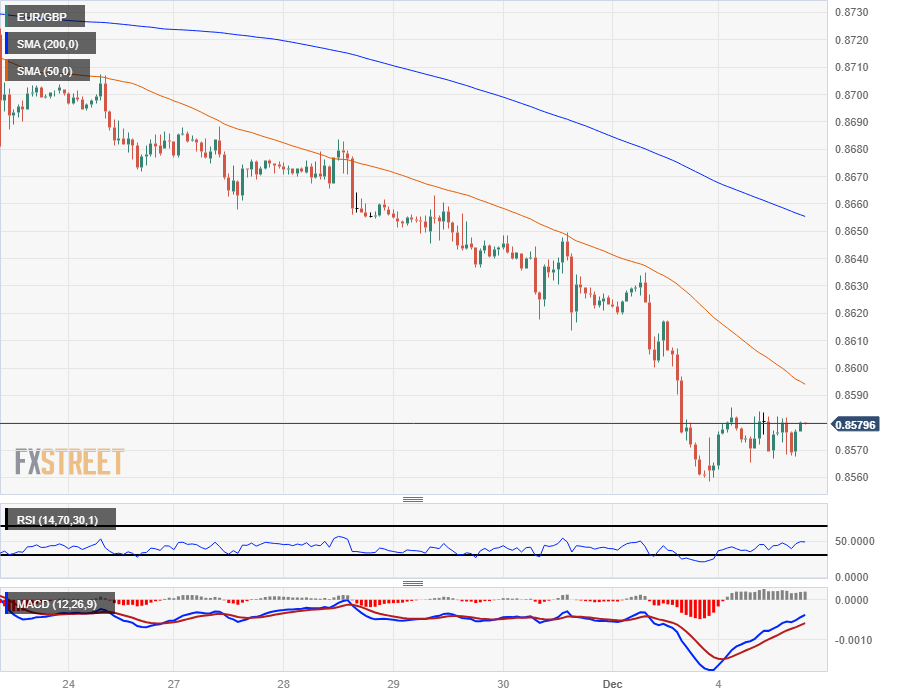
Monday represents the Euro's next chance to try and reverse recent declines, with EUR bidders looking to kick off a fresh bullish rally after the new week's early rebound from 0.8560.
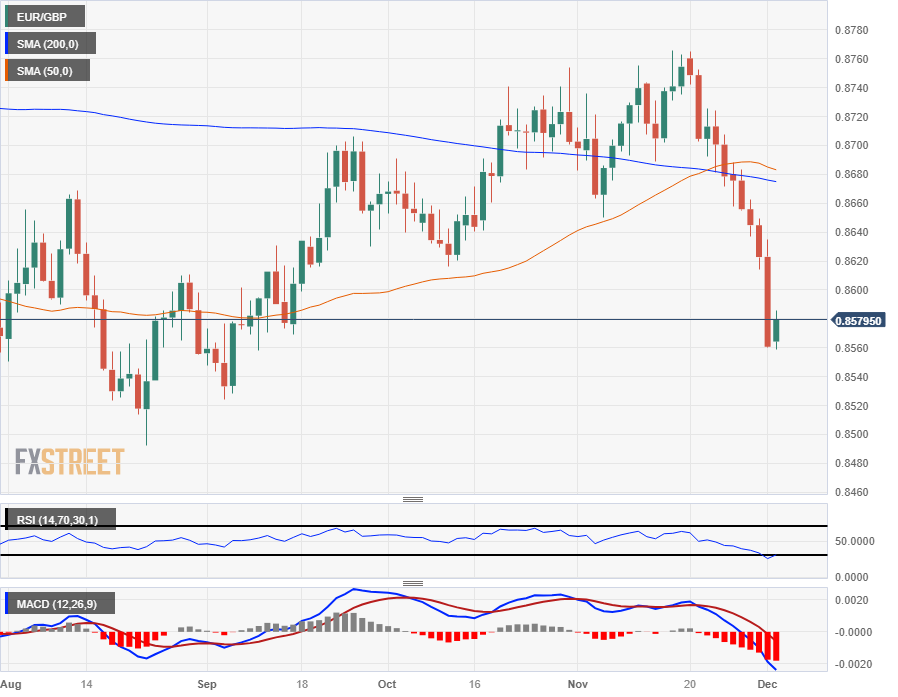
The EUR/GBP has closed in the red for nine of the last ten trading sessions, shedding two and a third percent peak-to-trough since retreating from November's high bids of 0.8765, slipping cleanly through the 200-day Simple Moving Average (SMA).
The long-term moving average and the 50-day SMA are consolidating around 0.8680 and set to act as a magnet for medium-term price action rather than a hard limit.
EUR/GBP Hourly Chart
EUR/GBP Daily Chart
EUR/GBP Technical Levels
EUR/GBP
Overview
Today last price0.858
Today Daily Change0.0019
Today Daily Change %0.22
Today daily open0.8561
Trends
Daily SMA200.8696
Daily SMA500.8685
Daily SMA1000.864
Daily SMA2000.8676
Levels
Previous Daily High0.8635
Previous Daily Low0.856
Previous Weekly High0.8688
Previous Weekly Low0.856
Previous Monthly High0.8766
Previous Monthly Low0.8614
Daily Fibonacci 38.2%0.8589
Daily Fibonacci 61.8%0.8606
Daily Pivot Point S10.8536
Daily Pivot Point S20.851
Daily Pivot Point S30.846
Daily Pivot Point R10.861
Daily Pivot Point R20.866
Daily Pivot Point R30.8686
Author

Joshua Gibson
FXStreet
Joshua joins the FXStreet team as an Economics and Finance double major from Vancouver Island University with twelve years' experience as an independent trader focusing on technical analysis.

















