EUR/GBP Price Forecasts: Trapped in a tightening range around 0.8700
- The Euro gives away previous gains against the Pound and returns below 0.8700.
- The pair has been trading choppy within a 70-pip range since early October.
- EUR/GBP price action is forming a symmetrical wedge pattern.

The Euro is giving away most of the gains taken on Wednesday on Thursday, amid the softer-than-expected UK inflation data, and returns below 0.8700. From a wider perspective, the pair continues to trade in a choppy manner, bouncing within a broadly 70-pip range, between 0.8665 and 0.8730.
UK inflation fell short of the market expectations with a 3.8% year-on-year growth in September, below the 4.0% rate anticipated by the market consensus. These figures boosted expectations that the Bank of England will cut interest rates further before the year's end, and sent the Pound tumbling against its main peers.
Technical analysis: Price action is forming a wedge pattern
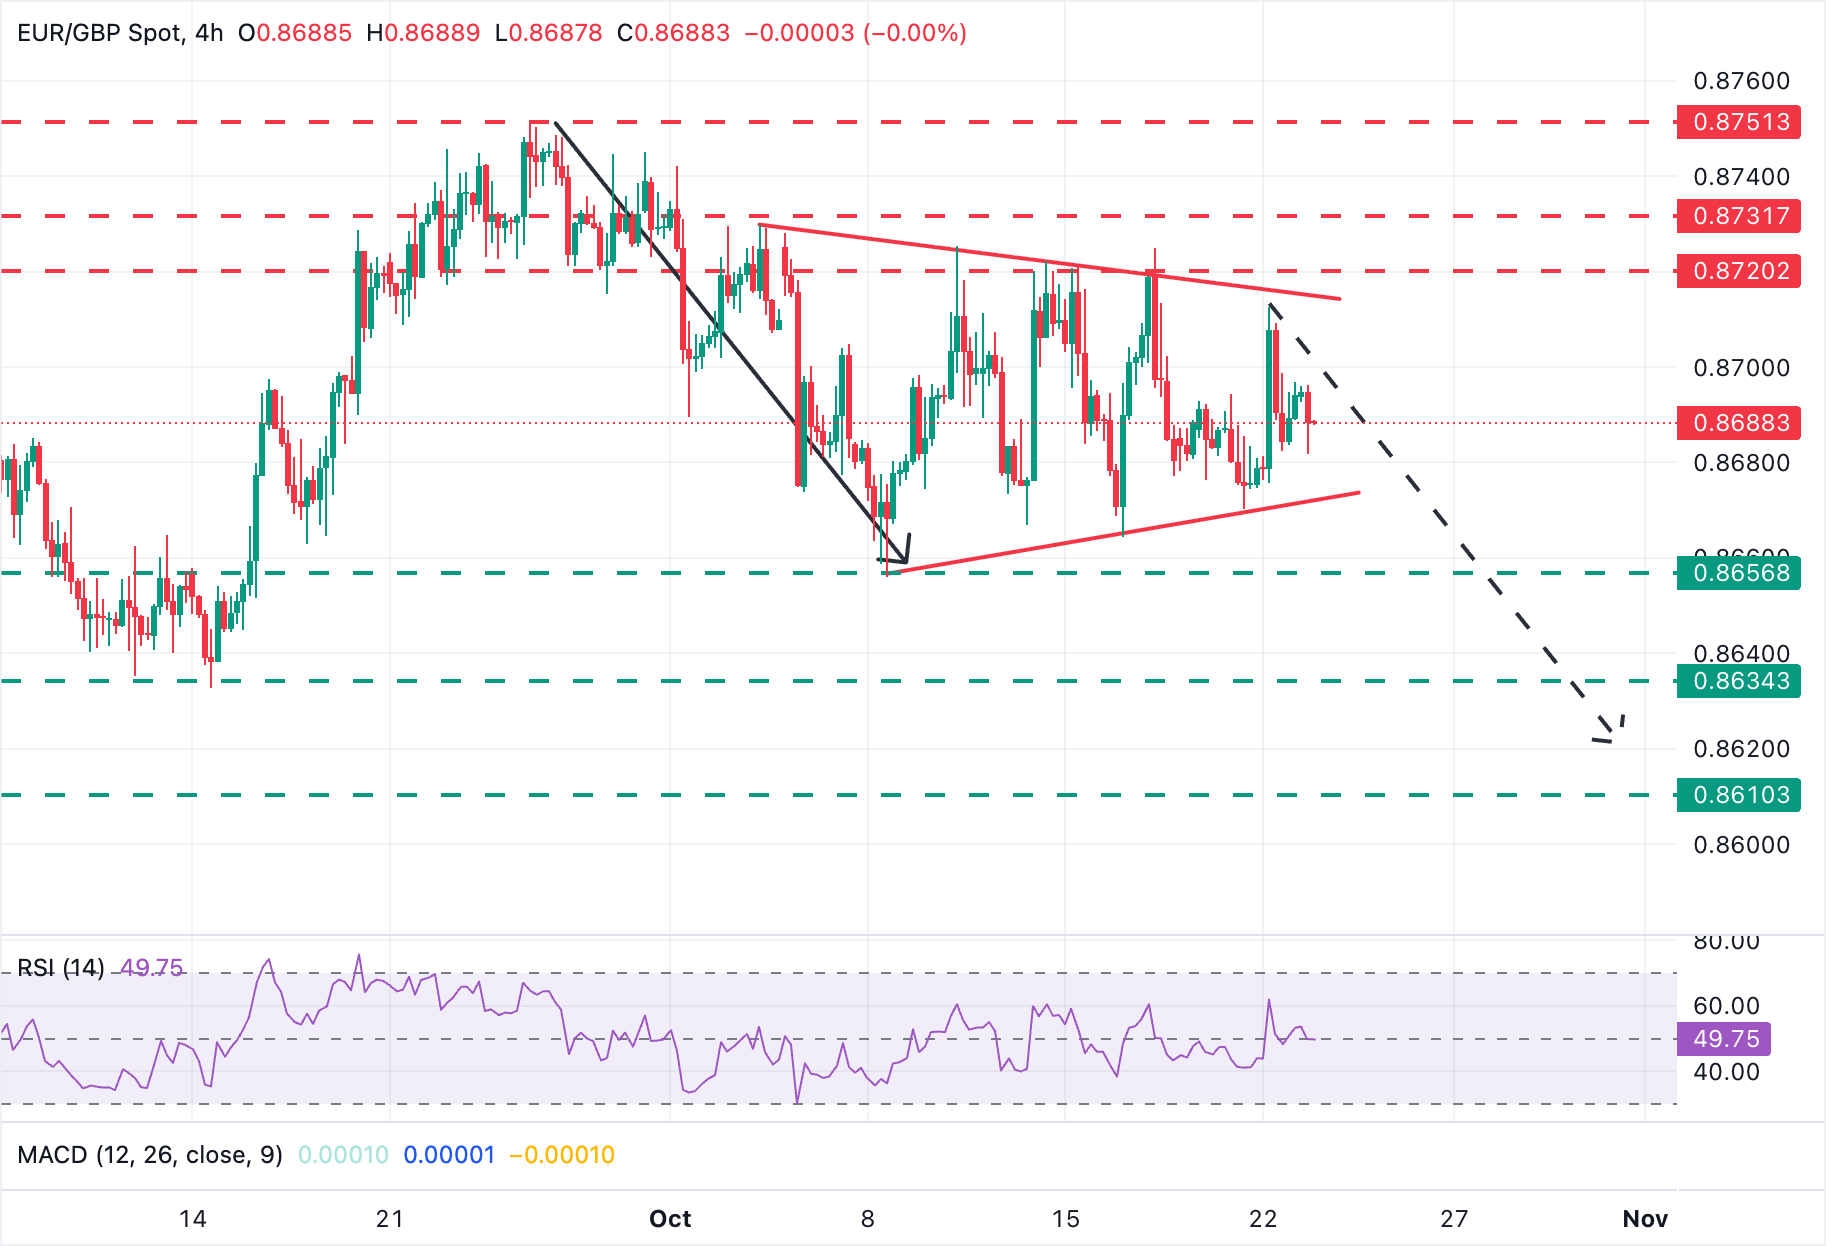
A look at the 4-hour chart shows price action moving into a gradually tightening range since early October, forming a symmetrical wedge around the 0.8700 level. This is considered a continuation pattern, which, in this case, would lead to a bearish outcome.
Immediate support is in the area between the triangle bottom, now at 0.8670, and the October 8 lows, at 0.8655. A confirmation below here clears the path towards the September 11 and 15 lows at 0.8635. The measured target of the wedge pattern is at the 0.8620 area.
To the upside, bulls will find a cluster of resistances between the triangle top at 0.8715 and the 0.8730 area, which has repeatedly capped upside attempts since early October. Above here, the target is the YTD high, at 0.8750.
Euro Price Today
The table below shows the percentage change of Euro (EUR) against listed major currencies today. Euro was the strongest against the Japanese Yen.
| USD | EUR | GBP | JPY | CAD | AUD | NZD | CHF | |
|---|---|---|---|---|---|---|---|---|
| USD | 0.10% | 0.04% | 0.34% | -0.01% | -0.29% | -0.17% | 0.15% | |
| EUR | -0.10% | -0.05% | 0.25% | -0.10% | -0.37% | -0.26% | 0.06% | |
| GBP | -0.04% | 0.05% | 0.28% | -0.04% | -0.32% | -0.20% | 0.11% | |
| JPY | -0.34% | -0.25% | -0.28% | -0.37% | -0.62% | -0.53% | -0.19% | |
| CAD | 0.01% | 0.10% | 0.04% | 0.37% | -0.27% | -0.15% | 0.16% | |
| AUD | 0.29% | 0.37% | 0.32% | 0.62% | 0.27% | 0.12% | 0.44% | |
| NZD | 0.17% | 0.26% | 0.20% | 0.53% | 0.15% | -0.12% | 0.32% | |
| CHF | -0.15% | -0.06% | -0.11% | 0.19% | -0.16% | -0.44% | -0.32% |
The heat map shows percentage changes of major currencies against each other. The base currency is picked from the left column, while the quote currency is picked from the top row. For example, if you pick the Euro from the left column and move along the horizontal line to the US Dollar, the percentage change displayed in the box will represent EUR (base)/USD (quote).
Author

Guillermo Alcala
FXStreet
Graduated in Communication Sciences at the Universidad del Pais Vasco and Universiteit van Amsterdam, Guillermo has been working as financial news editor and copywriter in diverse Forex-related firms, like FXStreet and Kantox.


