EUR/GBP Price Forecasts: Returns above 0.8700 as the Pound dives
- The Euro bounced up above 0.8700 following soft UK CPI data.
- UK Price pressures grew at a steady 3.8% yearly pace in September, against expectations of a 4.0% reading.
- EUR/GBP remains trading in a range with a triangle pattern in progress.

The Euro jumped to intra-week highs above 0.8700 earlier on Wednesday, buoyed by the Pound's weakness following softer-than-expected UK inflation data. The pair, however, keeps trading in a choppy and volatile manner, trapped within an 80-pip range.
September’s UK consumer prices undershot the market consensus earlier on the day. The yearly CPI remained steady at 3.8%, against expectations of an acceleration to 4%, which feeds hopes that the BoE might cut rates again before the end of the year.
Technical analysis: EUR/GBP is forming a triangle pattern
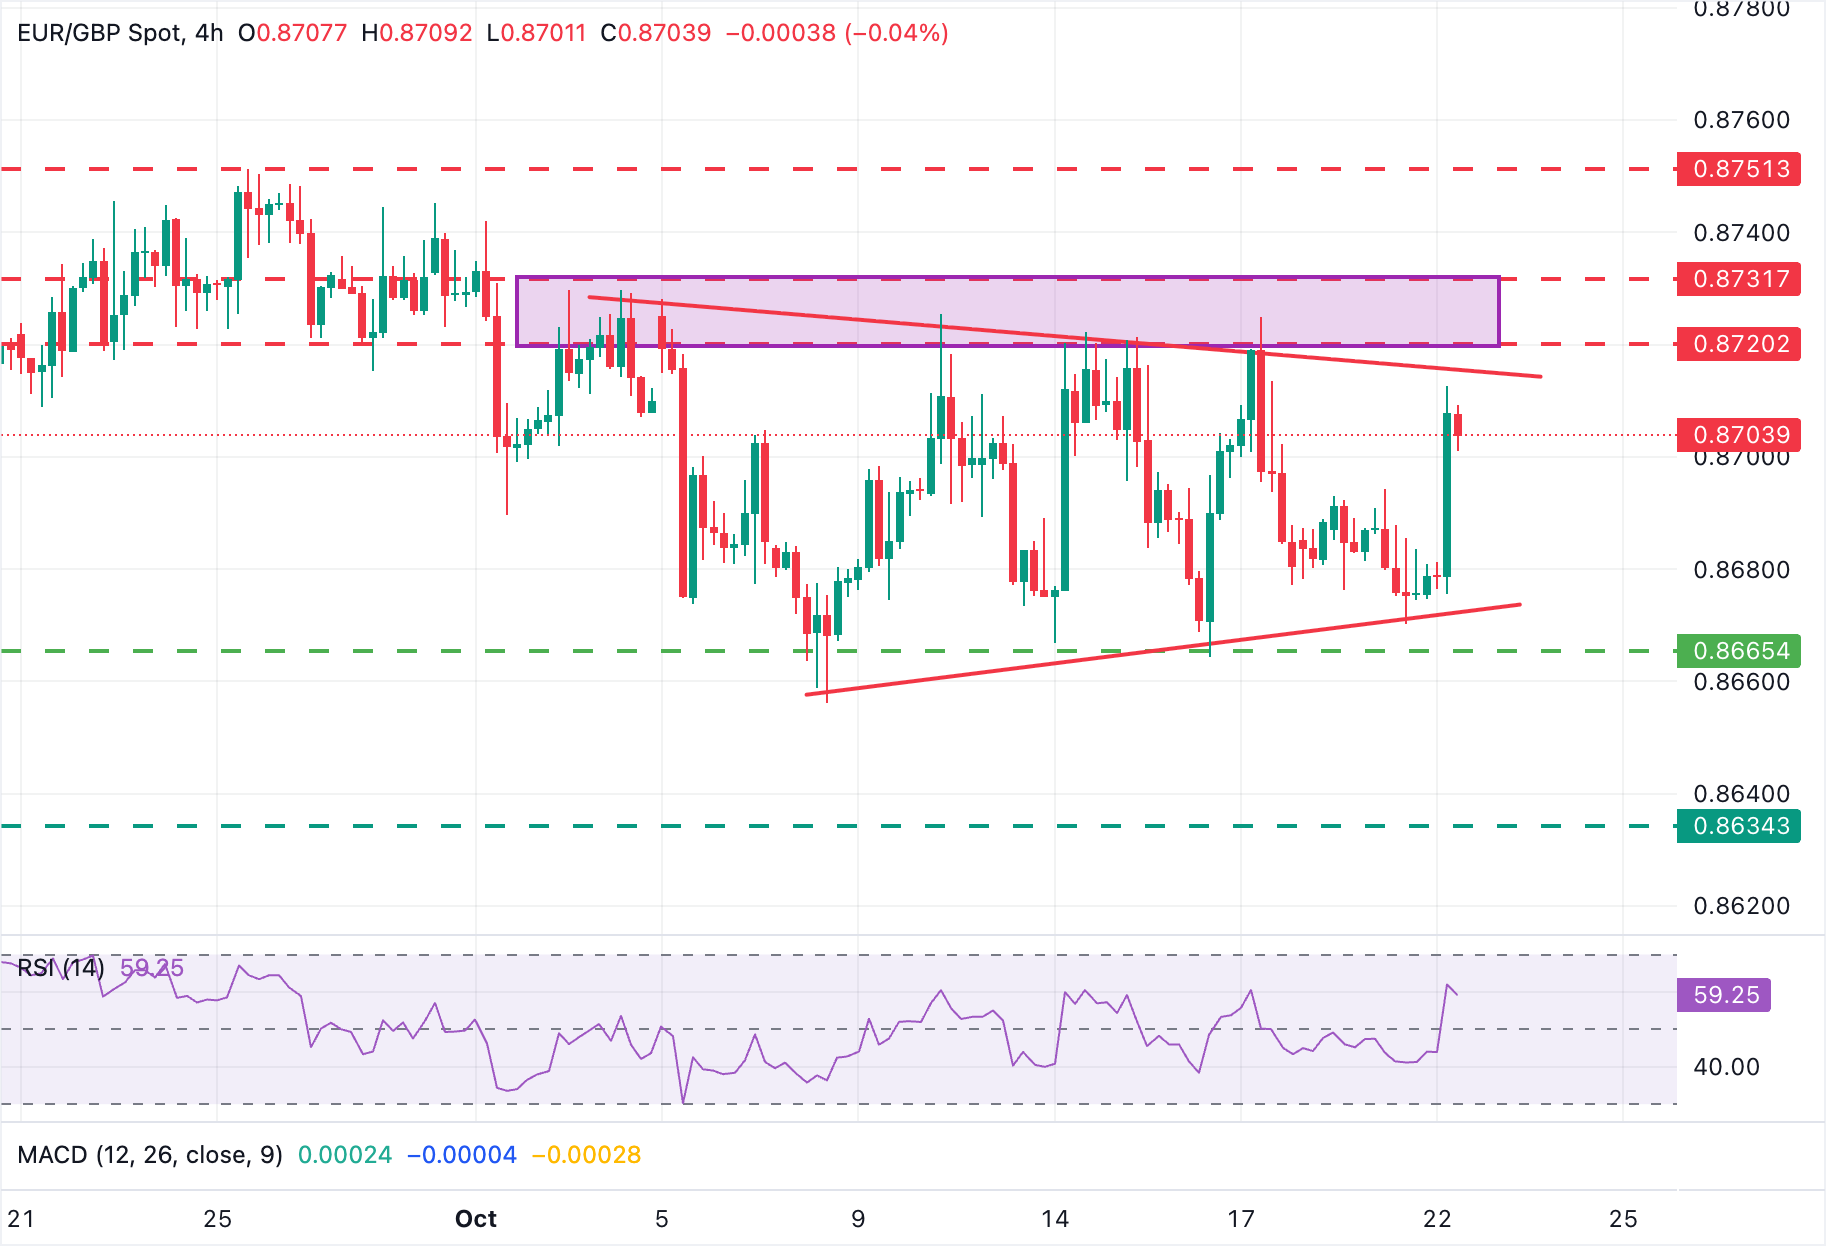
The Technical picture shows the pair trading sideways within a gradually tightening range, highlighting a triangle formation in progress. Triangles are usually continuation patterns, and in this case, it would suggest a bearish outcome.
The pair has reached intra-day highs a few pips below a cluster of resistances between the triangle top at 0.8715 and the 0.8730 area, which has repeatedly capped upside attempts since early October. Above here, the target is the YTD high, at 0.8750.
The triangle bottom, at the 0.8670 area, and October 14, 16 lows, at 0.8660, are the nearest support levels. Further down, the September 11 and 15 lows at 0.8635 and the August 10 low at 0.8610 would come to focus.
Pound Sterling Price Today
The table below shows the percentage change of British Pound (GBP) against listed major currencies today. British Pound was the strongest against the Euro.
| USD | EUR | GBP | JPY | CAD | AUD | NZD | CHF | |
|---|---|---|---|---|---|---|---|---|
| USD | 0.10% | 0.43% | -0.09% | -0.01% | 0.02% | 0.00% | 0.03% | |
| EUR | -0.10% | 0.32% | -0.19% | -0.11% | -0.09% | -0.07% | -0.07% | |
| GBP | -0.43% | -0.32% | -0.51% | -0.43% | -0.41% | -0.39% | -0.38% | |
| JPY | 0.09% | 0.19% | 0.51% | 0.08% | 0.12% | 0.12% | 0.14% | |
| CAD | 0.00% | 0.11% | 0.43% | -0.08% | 0.03% | 0.04% | 0.04% | |
| AUD | -0.02% | 0.09% | 0.41% | -0.12% | -0.03% | 0.02% | 0.01% | |
| NZD | -0.01% | 0.07% | 0.39% | -0.12% | -0.04% | -0.02% | 0.00% | |
| CHF | -0.03% | 0.07% | 0.38% | -0.14% | -0.04% | -0.01% | -0.01% |
The heat map shows percentage changes of major currencies against each other. The base currency is picked from the left column, while the quote currency is picked from the top row. For example, if you pick the British Pound from the left column and move along the horizontal line to the US Dollar, the percentage change displayed in the box will represent GBP (base)/USD (quote).
Author

Guillermo Alcala
FXStreet
Graduated in Communication Sciences at the Universidad del Pais Vasco and Universiteit van Amsterdam, Guillermo has been working as financial news editor and copywriter in diverse Forex-related firms, like FXStreet and Kantox.


