|

EUR/GBP Price Forecast: Reaches crossroads after completing abc move and pulling back

  • EUR/GBP completes an abc move higher after bouncing from multi-year lows. 
  • A break above the top of the pattern could be a sign of a reversal and birth of a new uptrend.

EUR/GBP pulls back after peaking in the 0.8440s. On Tuesday it bounced off key support (gray dashed line) at multi-year lows and surged over a penny higher. In the process it completed a three-wave, zig-zag-shaped pattern, with waves labeled a,b and c. 

EUR/GBP 4-hour Chart 

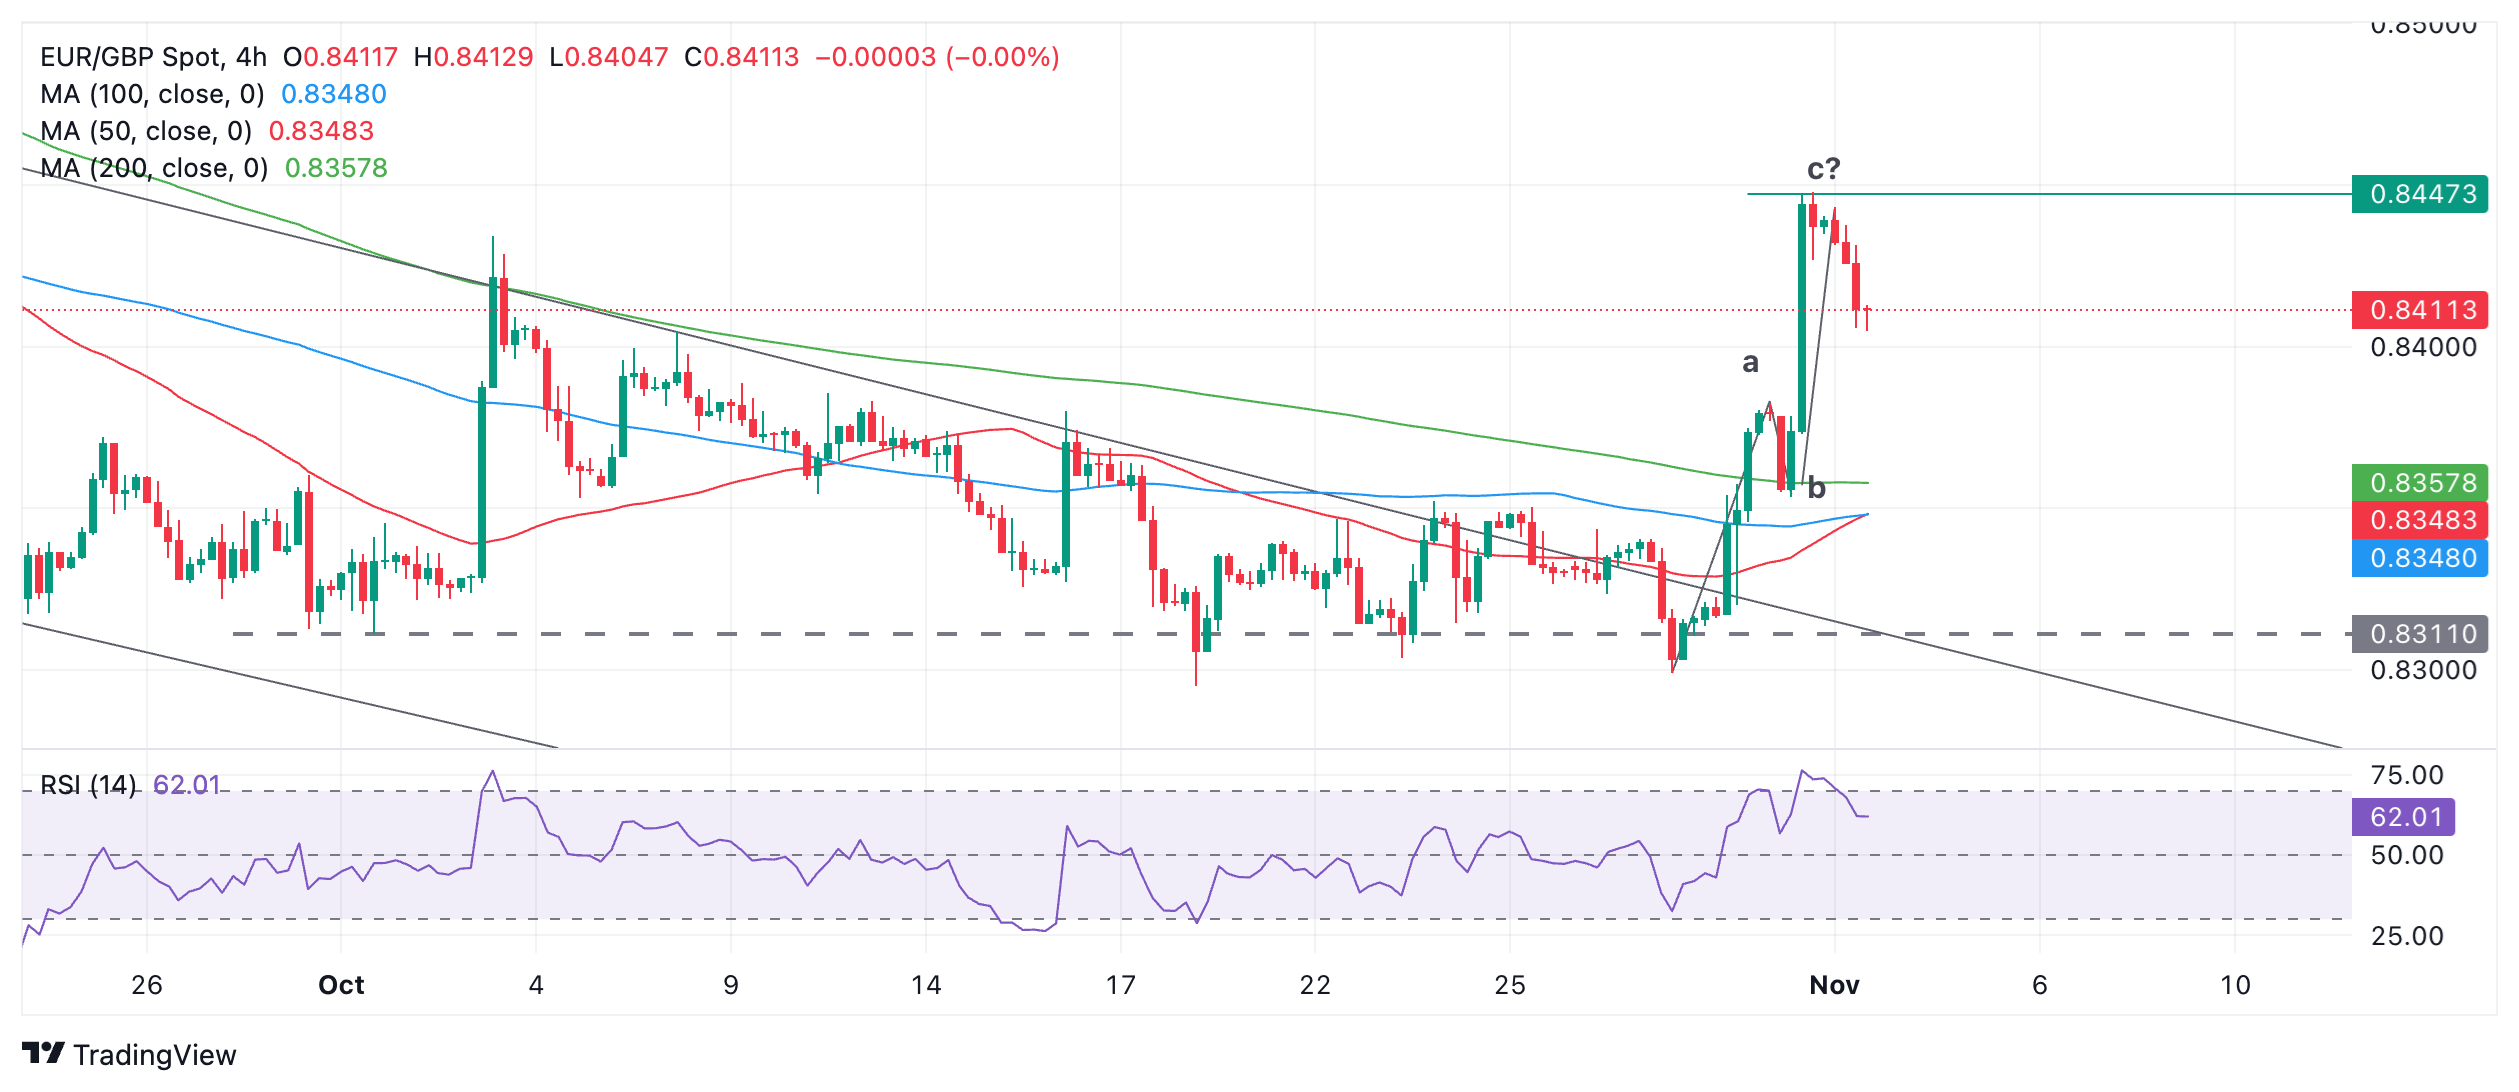
It is possible this pattern is just a common three-wave abc correction. If so, this could imply the correction is now probably finished, that price will roll over, and return to the base of the consolidation and the multi-year low. 

However, the speed and strength of the move higher witnessed over the last few days suggests EUR/GBP may not just be correcting, but rather that it could be starting a new short-term uptrend. 

The test of whether this is the case or not, will be to see whether price can now break above the top of wave c at 0.8448 (green resistance level on chart). If it can, it will have formed a third higher high and established a new sequence of rising peaks and troughs, heralding the start of a new uptrend. Give the technical analysis principle that “the trend is your friend” the odds would then favor further upside to come. 

If pierce cannot make a new higher high above wave c, it is possible EUR/GBP will decline again as it continues unfolding its sideways range-bound trend.

Author

Joaquin Monfort

Joaquin Monfort is a financial writer and analyst with over 10 years experience writing about financial markets and alt data. He holds a degree in Anthropology from London University and a Diploma in Technical analysis.

More from Joaquin Monfort
Share:

Editor's Picks

AUD/USD eyes 0.7150 barrier nine-day EMA

AUD/USD inches higher after registering modest losses in the previous day, trading around 0.7130 during the Asian hours. The technical analysis of the daily chart indicates that the pair is moving sideways within the rectangle pattern, suggesting a consolidation as neither the bulls nor the bears have enough momentum to take control of the market.

USD/JPY trades below 160.00 intervention threshold; bullish bias intact

The USD/JPY pair attracts some sellers during the Asian session amid fears that authorities will step in again to prop up the Japanese Yen. Furthermore, the Israel-Lebanon truce prompts some profit-taking around the US Dollar and exerts downward pressure on the currency pair.

Gold meets contention near $4,420…for now

Gold extends its recovery past the $4,500 mark per troy ounce on Thursday. The yellow metal’s advance comes amid the resurgence of some selling interest around the, improving risk sentiment, and declining US Treasury yields across the curve.

Bitcoin’s massive storm is back: Why the sell-off is far from over

Bitcoin price action over the last few weeks has felt less like a normal, healthy correction and more like a slow grinding crash that continues to wreak havoc on holdings and trading accounts. And everything suggests that the dramatic crash isn’t over.

Nonfarm payrolls: Testing the limits of Fed policy patience

The upcoming nonfarm payrolls report for May will provide the final update on the US labor market before Kevin Warsh attends his first policy meeting as the new Fed Chair later this month.

Recession on paper: What really moves the Canadian Loonie now?

Statistics Canada handed the headline writers a gift and the analysts a headache. Real GDP shrank 0.1% on an annualized basis in the first quarter, and with the fourth quarter of 2025 revised down to a 1.0% contraction, that is two negative quarters in a row, the textbook definition of a technical recession and Canada's first since the pandemic.