EUR/GBP Price Forecast: Euro approaches 0.8740 resistance area
- The Euro appreciates for the second consecutive day, approaching the 0.8740 resistance area.
- Upbeat Services data has provided additional support to the Euro on Friday.
- EUR/GBP: A break of 0.8740 resistance brings the YTD high, at 0.8750, back to focus.

The Euro is trading higher for the second consecutive day against the British Pound on Friday. The pair found support right below 0.8700 earlier this week, but has managed to pare losses supported by hawkish comments from ECB officials and upbeat Services activity data.
The final reading of the Eurozone HCOB PMI, released earlier on the day, revealed that the sector’s activity improved to 51.3 in September from 50.1 in August,
These numbers are slightly below the 51.4 seen in the preliminary report, but still the best performance since January, and follow a moderately positive Manufacturing survey on Thursday, to ease concerns about a severe impact from US tariffs, at least for now.
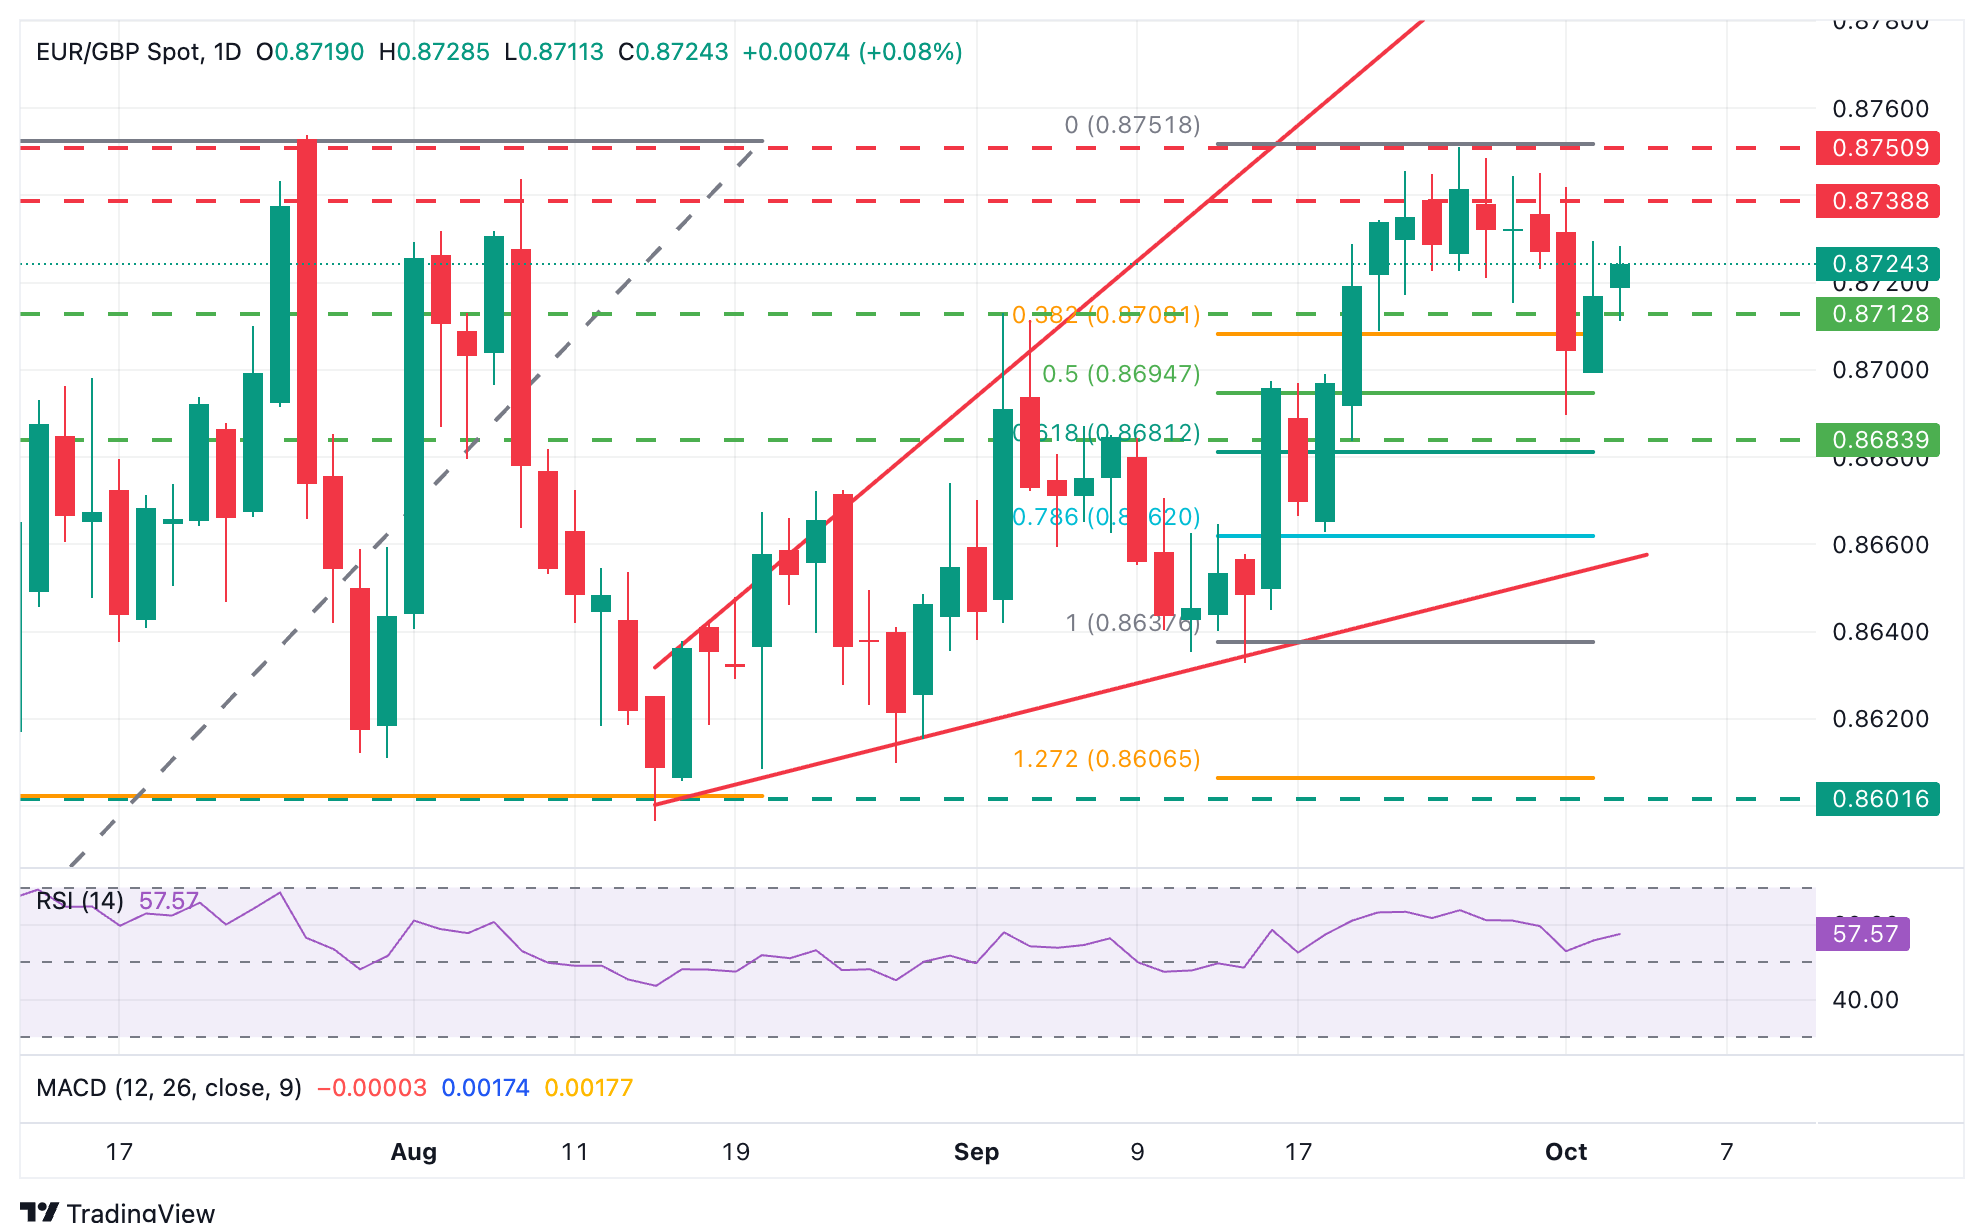
Technical Analysis: EUR/GBP has reached the target of the H&S pattern
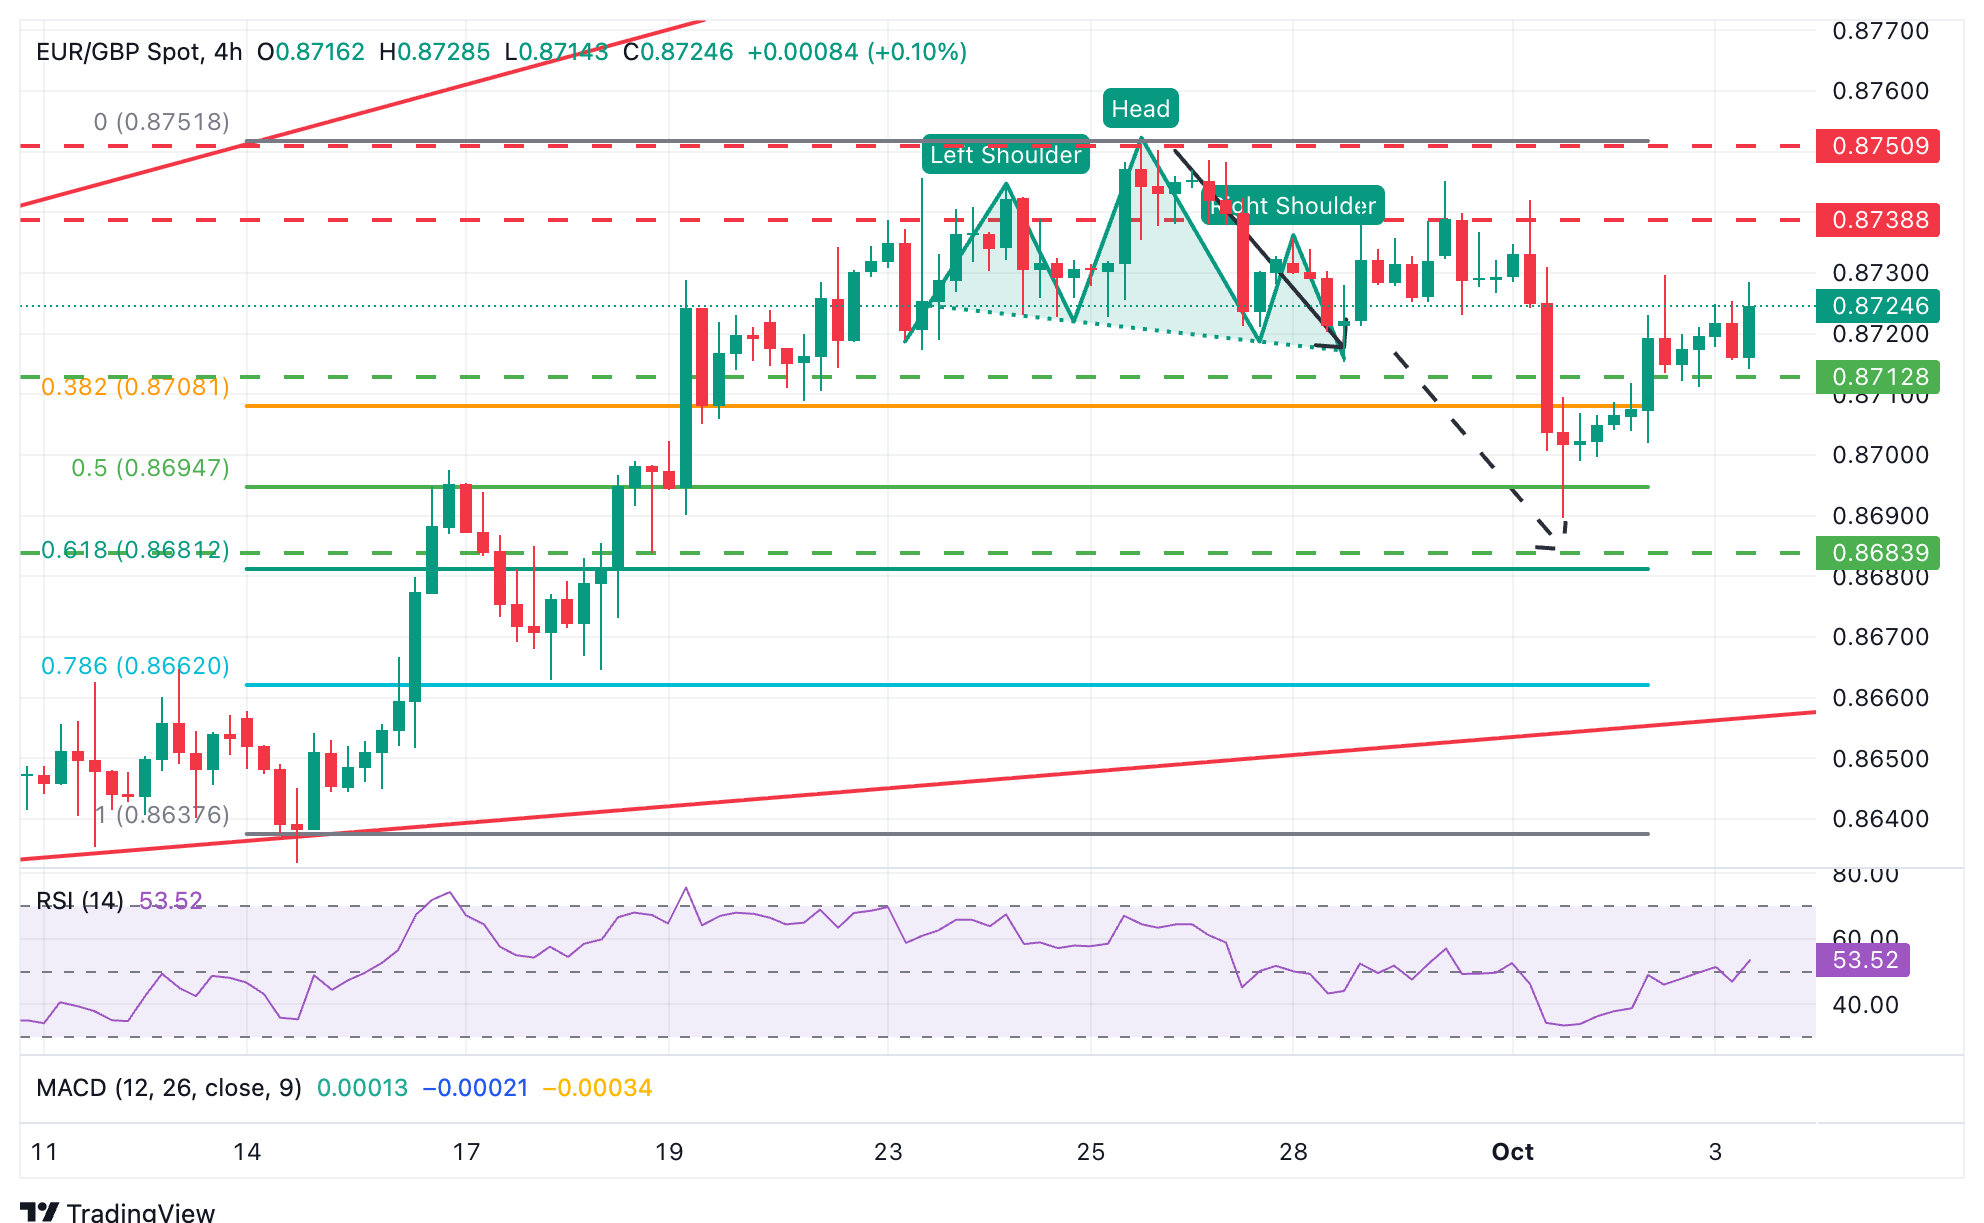
The 4-hour chart shows that the pair is trading higher after hitting the target of a bearish Head & Shoulders pattern, which meets the 61.8% Fibonacci retracement of the late September rally, in the area of 0.8680.
The pair is now aiming for the resistance area at 0.8740-0.8745, which capped bulls on September 30 and October 1. A confirmation above here would suggest that the bearish correction is over and bring the year-to-date high, at 0.8750, back to the focus.
A bearish reversal from current levels, on the flip side, is likely to seek support at the intraday lows around 0.8710 ahead of the October 1 lows, at 0.8685. Further down, the confluence of the 78.2% Fibonacci retracement of the mentioned rally, September 17 lows, and trendline support is at 0.8660.
Euro Price Today
The table below shows the percentage change of Euro (EUR) against listed major currencies today. Euro was the strongest against the Japanese Yen.
| USD | EUR | GBP | JPY | CAD | AUD | NZD | CHF | |
|---|---|---|---|---|---|---|---|---|
| USD | -0.19% | -0.16% | 0.06% | -0.03% | -0.19% | -0.31% | -0.13% | |
| EUR | 0.19% | 0.08% | 0.22% | 0.18% | 0.00% | -0.12% | 0.06% | |
| GBP | 0.16% | -0.08% | 0.20% | 0.07% | -0.08% | -0.21% | -0.03% | |
| JPY | -0.06% | -0.22% | -0.20% | -0.09% | -0.26% | -0.38% | -0.21% | |
| CAD | 0.03% | -0.18% | -0.07% | 0.09% | -0.14% | -0.28% | -0.10% | |
| AUD | 0.19% | -0.01% | 0.08% | 0.26% | 0.14% | -0.13% | 0.05% | |
| NZD | 0.31% | 0.12% | 0.21% | 0.38% | 0.28% | 0.13% | 0.18% | |
| CHF | 0.13% | -0.06% | 0.03% | 0.21% | 0.10% | -0.05% | -0.18% |
The heat map shows percentage changes of major currencies against each other. The base currency is picked from the left column, while the quote currency is picked from the top row. For example, if you pick the Euro from the left column and move along the horizontal line to the US Dollar, the percentage change displayed in the box will represent EUR (base)/USD (quote).
,
Author

Guillermo Alcala
FXStreet
Graduated in Communication Sciences at the Universidad del Pais Vasco and Universiteit van Amsterdam, Guillermo has been working as financial news editor and copywriter in diverse Forex-related firms, like FXStreet and Kantox.


