EUR/GBP Price Analysis: Recovery pokes 0.8790 resistance confluence


  • EUR/GBP takes the bids to refresh intraday low after snapping two-day downtrend.
  • Convergence of 200-EMA, immediate descending trend line guards recovery moves.
  • 50% Fibonacci retracement appears the key support for bears to watch.

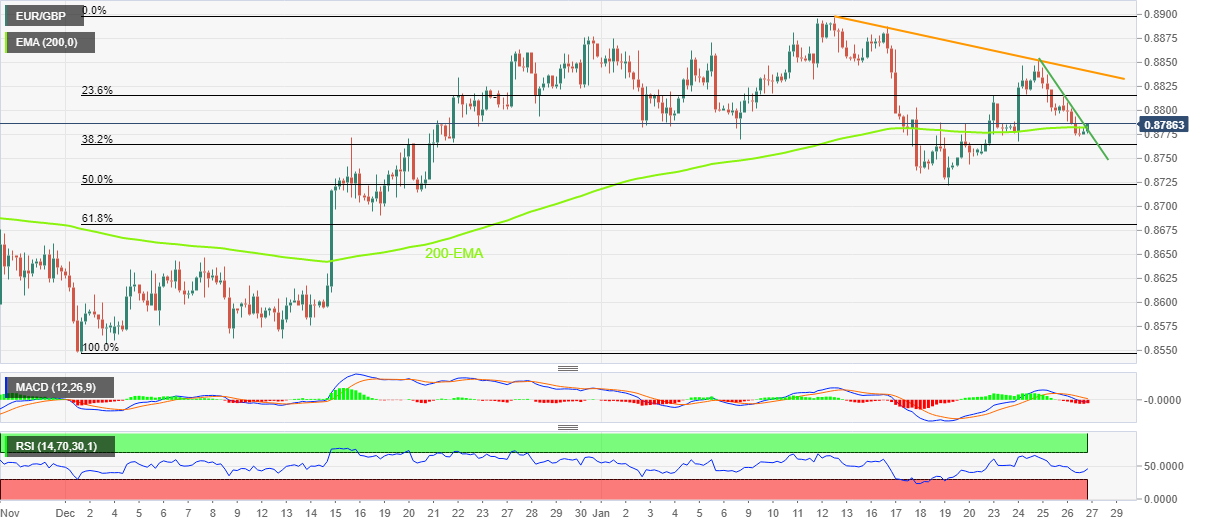
EUR/GBP bulls struggle to retake control as the cross-currency pair renews intraday high near 0.8785 heading into Friday’s European session.

In doing so, the quote jostles with the 200-bar Exponential Moving Average (EMA) and a downward-sloping resistance line from Wednesday, close to the 0.8785-90 hurdle.

It’s worth noting that the receding bearish bias of the MACD and the RSI (14) attempt to regain the 50 level keeps the EUR/GBP buyers hopeful.

Also luring the EUR/GBP bulls could be the cross-currency pair’s bounce off the 50% Fibonacci retracement level of December 01, 2022, to January 13, 2023 upside, close to 0.8720.

Hence, the quote’s one more attempt to break the two-week-old resistance line, around 0.8840 by the press time, can’t be ruled out. Following that, a run-up to the monthly peak of 0.8897 becomes imminent.

Meanwhile, the EUR/GBP pair’s fresh weakness remains unimportant till it stays beyond the 50% Fibonacci retracement level of 0.8722.

In a case where EUR/GBP remains bearish past 0.8720, the 61.8% Fibonacci retracement level, also known as the golden ratio, could act as the last defense of the buyers around 0.8680.

Overall, EUR/GBP is likely to witness further recovery but the bulls are far from retaking control.

EUR/GBP: Four-hour chart

Trend: Corrective bounce expected

Additional important levels

Overview
Today last price 0.8783
Today Daily Change 0.0009
Today Daily Change % 0.10%
Today daily open 0.8774
 
Trends
Daily SMA20 0.8814
Daily SMA50 0.8733
Daily SMA100 0.8734
Daily SMA200 0.862
 
Levels
Previous Daily High 0.8815
Previous Daily Low 0.8773
Previous Weekly High 0.8887
Previous Weekly Low 0.8722
Previous Monthly High 0.8877
Previous Monthly Low 0.8547
Daily Fibonacci 38.2% 0.8789
Daily Fibonacci 61.8% 0.8799
Daily Pivot Point S1 0.876
Daily Pivot Point S2 0.8746
Daily Pivot Point S3 0.8718
Daily Pivot Point R1 0.8801
Daily Pivot Point R2 0.8829
Daily Pivot Point R3 0.8843


Share: Feed news

Information on these pages contains forward-looking statements that involve risks and uncertainties. Markets and instruments profiled on this page are for informational purposes only and should not in any way come across as a recommendation to buy or sell in these assets. You should do your own thorough research before making any investment decisions. FXStreet does not in any way guarantee that this information is free from mistakes, errors, or material misstatements. It also does not guarantee that this information is of a timely nature. Investing in Open Markets involves a great deal of risk, including the loss of all or a portion of your investment, as well as emotional distress. All risks, losses and costs associated with investing, including total loss of principal, are your responsibility. The views and opinions expressed in this article are those of the authors and do not necessarily reflect the official policy or position of FXStreet nor its advertisers. The author will not be held responsible for information that is found at the end of links posted on this page.

If not otherwise explicitly mentioned in the body of the article, at the time of writing, the author has no position in any stock mentioned in this article and no business relationship with any company mentioned. The author has not received compensation for writing this article, other than from FXStreet.

FXStreet and the author do not provide personalized recommendations. The author makes no representations as to the accuracy, completeness, or suitability of this information. FXStreet and the author will not be liable for any errors, omissions or any losses, injuries or damages arising from this information and its display or use. Errors and omissions excepted.

The author and FXStreet are not registered investment advisors and nothing in this article is intended to be investment advice.

Recommended content


Recommended content

Editors’ Picks

EUR/USD stays near 1.0700 after US data

EUR/USD stays near 1.0700 after US data

EUR/USD stays in a consolidation phase at around 1.0700 in the early American session on Wednesday. The data from the US showed a strong increase in Durable Goods Orders but failed to provide a boost to the US Dollar.

EUR/USD News

USD/JPY refreshes 34-year high, attacks 155.00 as intervention risks loom

USD/JPY refreshes 34-year high, attacks 155.00 as intervention risks loom

USD/JPY is renewing a multi-decade high, closing in on 155.00. Traders turn cautious on heightened risks of Japan's FX intervention. Broad US Dollar rebound aids the upside in the major. US Durable Goods data are next on tap. 

USD/JPY News

Gold manages to hold above $2,300

Gold manages to hold above $2,300

Gold struggles to stage a rebound following Monday's sharp decline but manages to hold above $2,300. The benchmark 10-year US Treasury bond yield stays in the green above 4.6% ahead of US data, not allowing XAU/USD to gain traction.

Gold News

Worldcoin looks set for comeback despite Nvidia’s 22% crash Premium

Worldcoin looks set for comeback despite Nvidia’s 22% crash

Worldcoin price is in a better position than last week's and shows signs of a potential comeback. This development occurs amid the sharp decline in the valuation of the popular GPU manufacturer Nvidia.

Read more

Three fundamentals for the week: US GDP, BoJ and the Fed's favorite inflation gauge stand out Premium

Three fundamentals for the week: US GDP, BoJ and the Fed's favorite inflation gauge stand out

While it is hard to predict when geopolitical news erupts, the level of tension is lower – allowing for key data to have its say. This week's US figures are set to shape the Federal Reserve's decision next week – and the Bank of Japan may struggle to halt the Yen's deterioration. 

Read more

Forex MAJORS

Cryptocurrencies

Signatures