|

EUR/GBP Price Analysis: Range-bound pair, with mixed technical outlook

  • EUR/GBP remains sideways, technical indicators are mixed.
  • Buyers got rejected by the 20-day SMA.
  • Indicators suggest a neutral to slightly bullish bias.

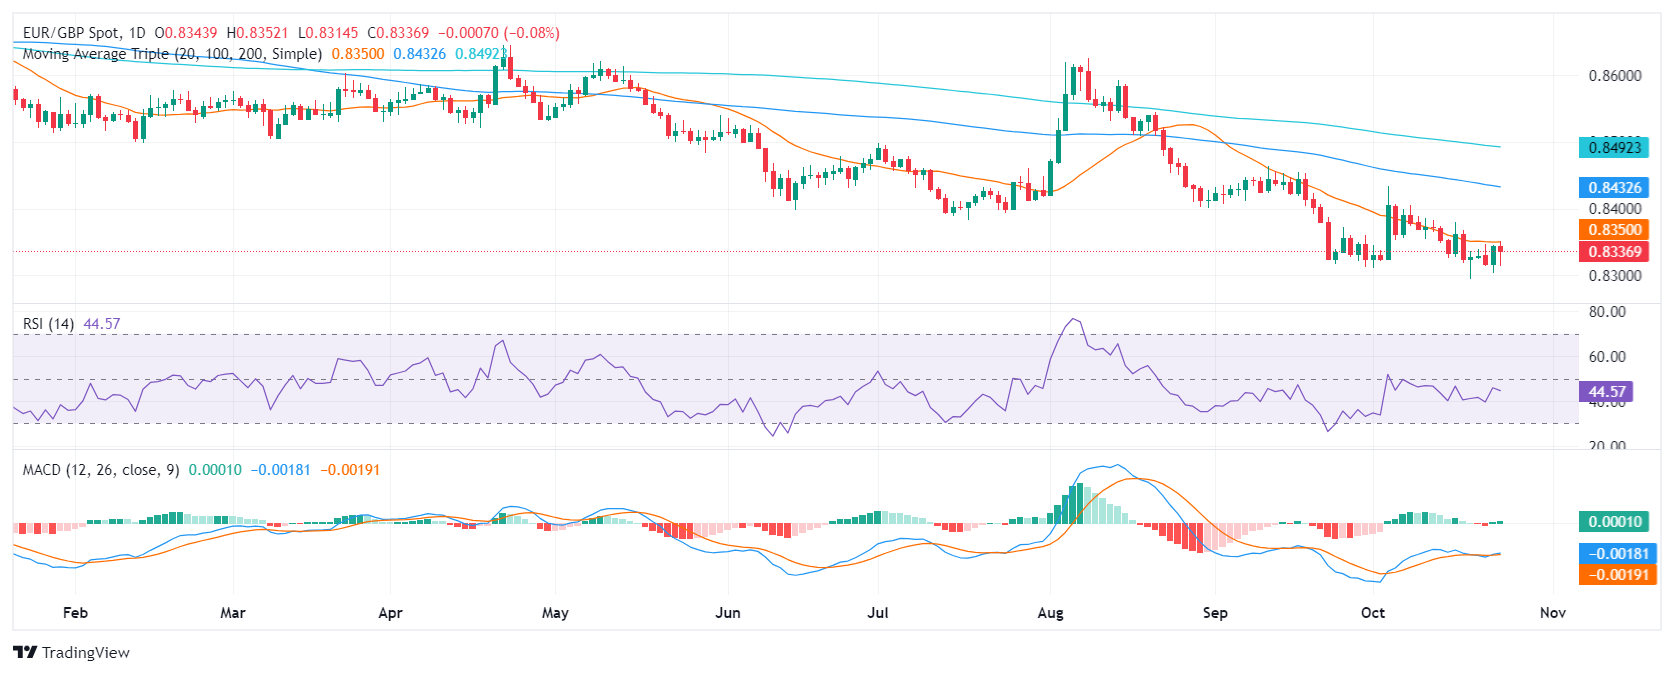
The EUR/GBP pair has been trading in a narrow range over the past few days, with minimal price fluctuations. The pair is currently trading at 0.8335, slightly lower than its opening price for the day after getting rejected by the 20-day Simple Moving Average (SMA).

Technical indicators are sending mixed signals. The Relative Strength Index (RSI) is hovering around 44, indicating that selling pressure is rising as it points down. However, the Moving Average Convergence Divergence (MACD) is green and rising, suggesting that buying pressure is also increasing. The overall short-term outlook is mixed, with the RSI indicating a bearish trend and the MACD indicating a bullish recovery.

In terms of support and resistance levels, support can be identified at 0.8330, 0.8315, and 0.8300, while resistance levels stand at 0.8350, 0.8370 and 0.8400. The pair is likely to continue trading within this range in the near term if the buyers are unable to conquer the 20-day SMA at 0.8350.

EUR/GBP daily chart
Author

Patricio Martín

Patricio is an economist from Argentina passionate about global finance and understanding the daily movements of the markets.


More from Patricio Martín
Share:

Editor's Picks

GBP/USD flirts with weekly highs in the Fed's aftermath

GBP/USD reversed early losses following the Federal Reserve decision to keep rates on hold and neared the 1.3360 level before shedding some ground. Focus shifts to Governor Kevin Warsh's speech, while the Bank of England will announce its monetary policy decision on Thursday.

EUR/USD extends rally pass 1.1450 on Fed's Warsh

EUR/USD trades at fresh weekly highs above 1.1450, following the Federal Reserve monetary policy decision to keep interest rates on hold. The statement showed policymakers remain confident in economic progress while blaming inflation on energy prices. The divided vote among officials put in doubt a September hike, leading to sharp US Dollar losses.

Gold  hovers around $4,100 as Fed decision hits the USD

Gold surged following the Federal Reserve's decision to keep the benchmark interest rate unchanged at 3.50%-3.75%. Policymakers noted that inflation remains elevated and that economic activity is expanding at a solid pace despite elevated uncertainty, spurring doubts about a rate hike in September. XAU/USD peaked above $4,100, now battling to retain the level.

Bitcoin slips below support, Ethereum and XRP flash bearish signals

Bitcoin, Ethereum and Ripple remain under pressure on Wednesday after a mild correction earlier this week. BTC slips below a key support zone, and ETH is testing a key resistance zone. Meanwhile, XRP is drifting toward the psychologically important $1.00 support level.

How the CLARITY Act unlocks Wall Street’s tokenization pipeline
The United States (US) Digital Asset Market Clarity Act (CLARITY Act), awaiting a full Senate floor vote, promises to unlock Wall Street’s potential to tokenize financial assets, including equities, US Treasuries, private credit, real estate and commodities at a scale that could supercharge the real-world asset (RWA) market from the current $17 billion level to $5.5 trillion by 2030, according to
US Dollar mid-year outlook: Exceptional currency, exceptional risks?
The US Dollar enters the second half of 2026 in a markedly different position from a year ago. The King currency has recovered, reflecting persistent US inflation, changing expectations for Fed policy, geopolitical tensions and renewed demand for defensive assets.