|

EUR/GBP Price Analysis: Pair trades near 0.8600 amid neutral short-term signals

  • EUR/GBP trades near the 0.8600 zone, easing slightly after the European session.
  • Despite today's dip, the broader structure remains bullish with supportive moving averages.
  • Support is seen at 0.8550 and 0.8526, while resistance lies at 0.8564 and 0.8591.

The EURGBP pair eased slightly on Wednesday, slipping toward the lower end of its recent consolidation range after the European session. The pair was last seen hovering near the 0.8600 area, reflecting a mild pullback within a still-bullish technical setup.

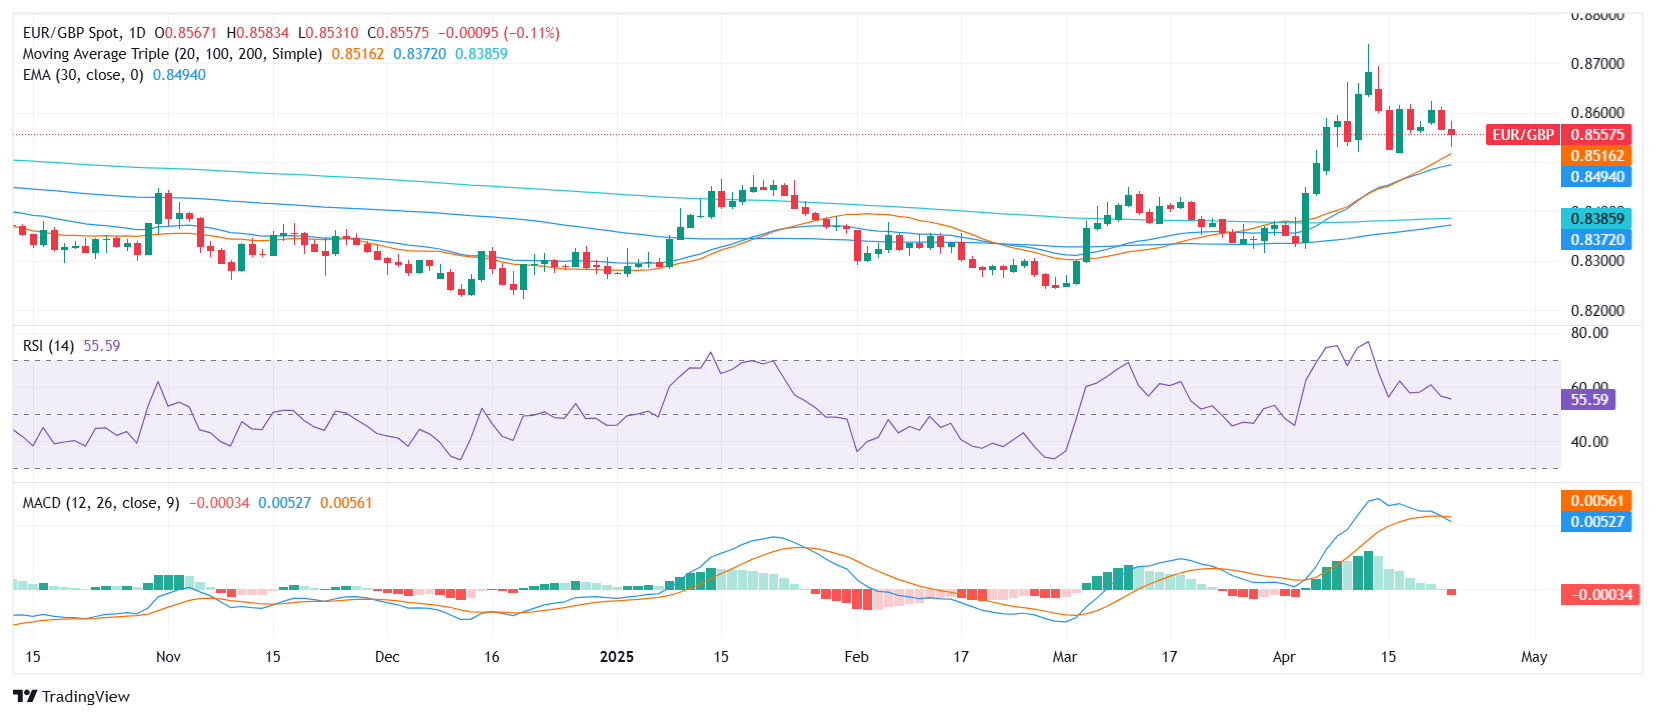
Momentum indicators are offering mixed cues. The Relative Strength Index stands around 55, indicating a neutral tone, while the MACD is currently printing a sell signal. The Ultimate Oscillator and Average Directional Index also remain in neutral territory, suggesting a lack of clear short-term directional conviction.

Despite this, the broader bias remains constructive. The 20-day simple moving average at 0.8516, along with the 100-day at 0.8372 and 200-day at 0.8387, all point upward. These longer-term signals are reinforced by bullish inputs from the 30-day exponential moving average at 0.8493 and the 30-day SMA at 0.8470.

Key support levels are located at 0.8550, 0.8527, and 0.8526. On the upside, immediate resistance is found at 0.8564, with additional barriers at 0.8569 and 0.8591. For now, the pair remains range-bound but retains a bullish tilt as long as it holds above the 0.8500 handle.

EUR/GBP Daily chart

Author

Patricio Martín

Patricio is an economist from Argentina passionate about global finance and understanding the daily movements of the markets.

More from Patricio Martín
Share:

Markets move fast. We move first.

Orange Juice Newsletter brings you expert driven insights - not headlines. Every day on your inbox.

By subscribing you agree to our Terms and conditions.

Editor's Picks

EUR/USD: Bulls pray for a dovish Fed

EUR/USD has finally taken a breather after a pretty energetic climb. The pair broke above 1.1680 in the second half of the week, reaching its highest levels in around two months before running into some selling pressure. Even so, it has gained almost two cents from the late-November dip just below 1.1500 the figure.

GBP/USD trims gains, recedes toward 1.3320

GBP/USD is struggling to keep its daily advance, coming under fresh pressure and retreating to the 1.3320 zone following a mild bullish attempt in the Greenback. Even though US consumer sentiment surprised to the upside, the US Dollar isn’t getting much love, as traders are far more interested in what the Fed will say next week.

Gold: Bullish momentum fades despite broad USD weakness

After rising more than 3.5% in the previous week, Gold has entered a consolidation phase and fluctuated at around $4,200. The Federal Reserve’s interest rate decision and revised Summary of Economic Projections, also known as the dot plot, could trigger the next directional move in XAU/USD. 

Week ahead: Rate cut or market shock? The Fed decides

Fed rate cut widely expected; dot plot and overall meeting rhetoric also matter. Risk appetite is supported by Fed rate cut expectations; cryptos show signs of life. RBA, BoC and SNB also meet; chances of surprises are relatively low. Dollar weakness could linger; both the aussie and the yen best positioned to gain further. Gold and oil eye Ukraine-Russia developments; a peace deal remains elusive.

Week ahead – Rate cut or market shock? The Fed decides

Fed rate cut widely expected; dot plot and overall meeting rhetoric also matter. Risk appetite is supported by Fed rate cut expectations; cryptos show signs of life. RBA, BoC and SNB also meet; chances of surprises are relatively low.

Ripple faces persistent bear risks, shrugging off ETF inflows

Ripple is extending its decline for the second consecutive day, trading at $2.06 at the time of writing on Friday. Sentiment surrounding the cross-border remittance token continues to lag despite steady inflows into XRP spot ETFs.