|

EUR/GBP Price Analysis: Pair drops again, nears multi-year lows

  • EUR/GBP declined 0.27% on Monday to near 0.8270, its lowest since March 2022.
  • The EUR/GBP pair remains in a strong downtrend, extending its losses over the past five trading days.
  • The RSI indicator is showing that selling pressure is rising, while the MACD indicator also indicates a bearish momentum.

The EUR/GBP pair fell on Monday, extending its losses and approaching multi-year lows. The decline continues a five-day downward trend, with the pair reaching 0.8270 on Monday after a 0.27% drop. Technical indicators like the Relative Strength Index (RSI) and Moving Average Convergence Divergence (MACD) point to bearish conditions, with selling pressure rising and overall momentum biased to the downside.

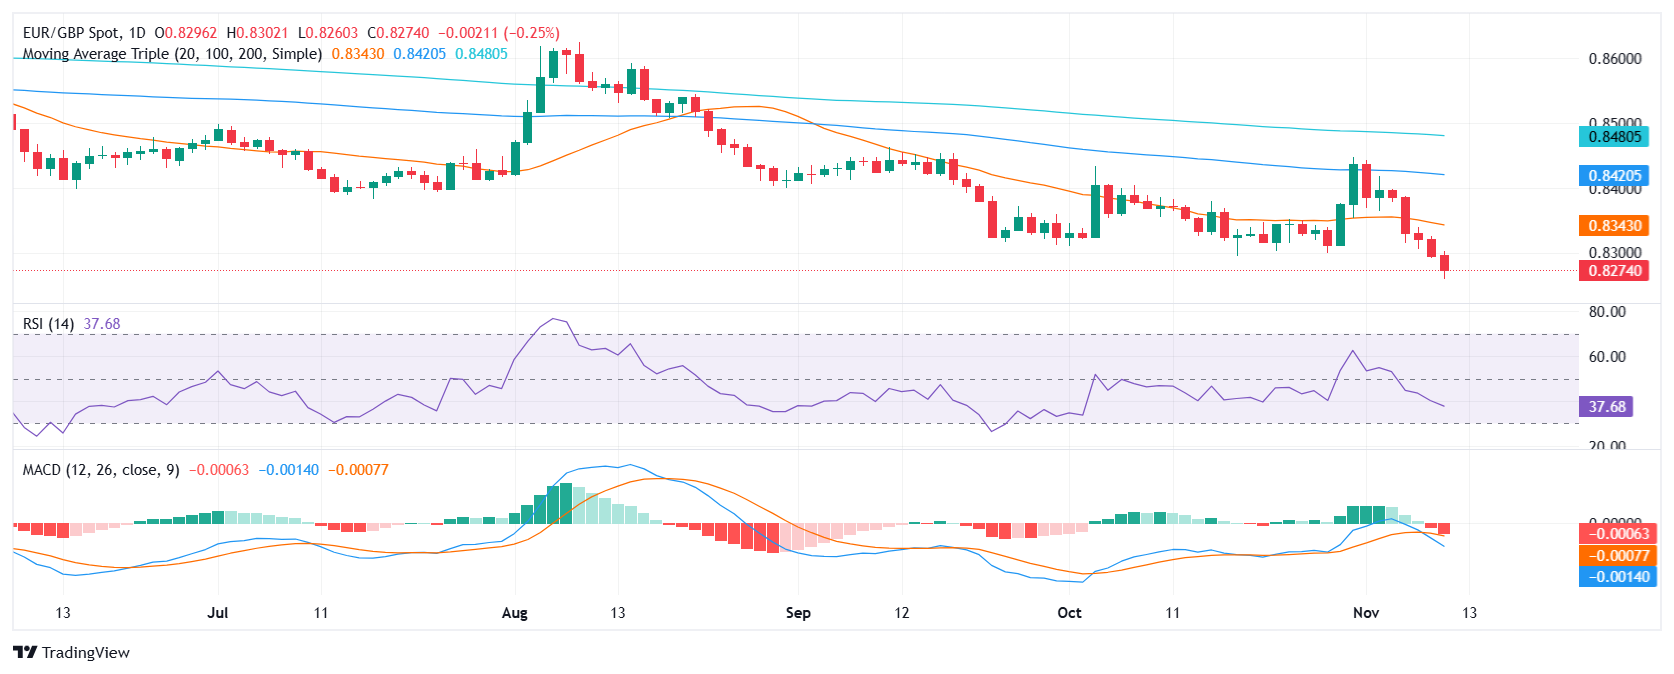
In the technical analysis, the RSI is at 38 and trending down, indicating rising selling pressure. The MACD histogram is below zero and red, further emphasizing the bearish momentum. Within the price action sphere, EUR/GBP has support levels at 0.8250, 0.8230, and 0.8210, and resistance levels at 0.8330, 0.8370, and 0.8390. These levels can provide guidance for potential trading opportunities.

The EUR/GBP pair continues to trade under bearish pressure, extending its downtrend and reaching multi-year lows since March 2022. Technical indicators, such as the RSI and MACD, indicate that selling pressure is escalating, while the extended losing streak and recent decline suggest that the trend is likely to persist.

EUR/GBP daily chart

Author

Patricio Martín

Patricio is an economist from Argentina passionate about global finance and understanding the daily movements of the markets.

More from Patricio Martín
Share:

Editor's Picks

AUD/USD eyes 0.7150 barrier nine-day EMA

AUD/USD inches higher after registering modest losses in the previous day, trading around 0.7130 during the Asian hours. The technical analysis of the daily chart indicates that the pair is moving sideways within the rectangle pattern, suggesting a consolidation as neither the bulls nor the bears have enough momentum to take control of the market.

USD/JPY trades below 160.00 intervention threshold; bullish bias intact

The USD/JPY pair attracts some sellers during the Asian session amid fears that authorities will step in again to prop up the Japanese Yen. Furthermore, the Israel-Lebanon truce prompts some profit-taking around the US Dollar and exerts downward pressure on the currency pair.

Gold puts its 200-day SMA to the test near $4,420

Gold keeps the bullish stance in place in the latter part of Thursday’s session, although a convincing break above the key $4,500 mark per troy ounce still remains elusive. The precious metal’s advance comes amid the resurgence of some selling interest around the Greenback, improving risk sentiment, and declining US Treasury yields across the board.

Bitcoin’s massive storm is back: Why the sell-off is far from over

Bitcoin price action over the last few weeks has felt less like a normal, healthy correction and more like a slow grinding crash that continues to wreak havoc on holdings and trading accounts. And everything suggests that the dramatic crash isn’t over.

Nonfarm payrolls: Testing the limits of Fed policy patience

The upcoming nonfarm payrolls report for May will provide the final update on the US labor market before Kevin Warsh attends his first policy meeting as the new Fed Chair later this month.

Recession on paper: What really moves the Canadian Loonie now?

Statistics Canada handed the headline writers a gift and the analysts a headache. Real GDP shrank 0.1% on an annualized basis in the first quarter, and with the fourth quarter of 2025 revised down to a 1.0% contraction, that is two negative quarters in a row, the textbook definition of a technical recession and Canada's first since the pandemic.