|

EUR/GBP Price Analysis: Grinds lower around 0.8450 on unimpressive UK GDP

  • EUR/GBP renews intraday high, before ticking lower, while staying inside a trend widening chart pattern.
  • UK Q2 GDP shrank 0.1% QoQ versus -0.2% expected, monthly statistics came out softer on MoM, firmer on YoY.
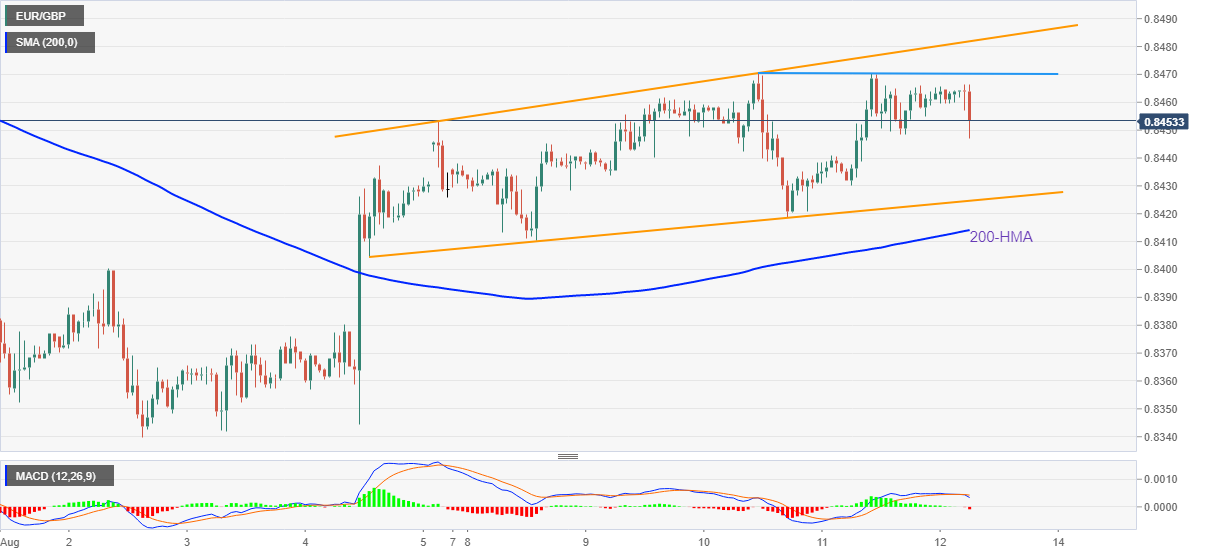
  • Double top around 0.8470 tests bulls, bears need validation from 200-HMA.

EUR/GBP remains pressured around 0.8460-55 area after an initial wick to 0.8447 on the UK’s firmer-than-expected growth numbers. However, the actual figures are way low under the previous readings and hence keep buyers hopeful despite the initial pullback.

That said, the headline UK Q2 GDP flashed -0.1% QoQ figures versus -0.2% forecast and 0.8% previous readings, per the first estimations from the UK’s National Statistics. Additionally details suggest that the monthly GDP contracted 0.6% MoM versus -1.3% expected and 0.5% prior. Further, the Industrial Production and Manufacturing Production readings marked upbeat YoY figures while reporting the softer monthly data, which are better than forecast disappointed.

Also read: GBP/USD seesaws 30-pip around 1.2200 on better-than-expected Q2 UK GDP

It should be noted that the trend widening megaphone formation restricts the EUR/GBP moves between 0.8480 and 0.8420.

However, the latest bearish signals from the MACD hint at the quote’s weakness towards the support. Also acting as the downside filter is the 200-HMA level of 0.8415.

Meanwhile, the double tops around 0.8470 guard immediate recovery moves of the EUR/GBP ahead of the 0.8480 hurdle comprising the stated megaphone’s upper line.

In a case where the quote rises past 0.8480, the odds of witnessing the 0.8500 threshold on the chart can’t be ruled out.

EUR/GBP: Hourly chart

Trend: Gradual upside expected

Additional important levels

Overview
Today last price0.8455
Today Daily Change-0.0003
Today Daily Change %-0.04%
Today daily open0.8458
 
Trends
Daily SMA200.8443
Daily SMA500.8511
Daily SMA1000.8471
Daily SMA2000.8441
 
Levels
Previous Daily High0.847
Previous Daily Low0.8421
Previous Weekly High0.8453
Previous Weekly Low0.834
Previous Monthly High0.8679
Previous Monthly Low0.8346
Daily Fibonacci 38.2%0.8451
Daily Fibonacci 61.8%0.844
Daily Pivot Point S10.8429
Daily Pivot Point S20.84
Daily Pivot Point S30.838
Daily Pivot Point R10.8478
Daily Pivot Point R20.8499
Daily Pivot Point R30.8528

Author

Anil Panchal

Anil Panchal

FXStreet

Anil Panchal has nearly 15 years of experience in tracking financial markets. With a keen interest in macroeconomics, Anil aptly tracks global news/updates and stays well-informed about the global financial moves and their implications.

More from Anil Panchal
Share:

Editor's Picks

EUR/USD slumps below 1.1750 as USD benefits from risk-aversion

EUR/USD comes under renewed bearish pressure in the European session and trades below 1.1750 following a recovery attempt earlier in the day. The US Dollar gathers strength and weighs on the pair as investors seek refuge in the wake of Israel and the United States' joint attack on Iran.

GBP/USD targets 1.3500 barrier near moving averages

GBP/USD rebounds from the daily losses, trading around 1.3450 during the Asian hours on Monday. The technical analysis of the daily chart indicates an ongoing bearish bias, as the pair trades within a descending channel pattern.

Gold surges on safe-haven demand, rises above $5,400

Gold benefits from intense risk-aversion on Monday and climbs above $5,400, setting a fresh monthly-high in the process. Tensions in the Middle East remain high as Israel and Hezbollah continue to exchange strikes following the US-Israel joint attack on Iran over the weekend.

Bitcoin, Ethereum and Ripple under pressure as key supports face breakdown risk

Bitcoin, Ethereum, and Ripple prices trade on the back foot at the start of this week on Monday, after extending losses in the previous week. BTC is on the brink of a breakdown, ETH is capped below key resistance, and XRP risks a crack of the trendline.

The market is paying for insurance, not apocalypse

As expected, this morning felt less like a Monday market open and more like a fire drill. Futures screens flickered red. S&P contracts down almost 1%. Nasdaq off 1.2%. Brent leaped 13% through $80. Gold rose 1.6% toward $5350 before paring some gains. The dollar is strutting mildly. The Swiss franc is quietly doing what it always does in a storm, catching some safe-haven flows.

Pi Network Price Forecast: Core team offloads supply, weighing on PI recovery

Pi Network  hovers below $0.1700, broadly steady at press time on Monday, attempting a recovery after a 2% loss the previous day. Sunday’s decline aligned with nearly 49 million PI tokens offloaded by the Pi Foundation, implying a spike in supply pressure that capped the prevailing four-day recovery.