|

EUR/GBP Price Analysis: Drops below 0.8800 on fragile sentiment

  • EUR/GBP slumped from weekly highs, forming a bearish-engulfing pattern; further downside is expected.
  • A clear break below 0.8730 would exert downward pressure on the EUR/GBP; a fall towards 0.8700 is likely to happen.

The EUR/GBP slightly climbs as the Asian Pacific session begins, following a solid session for the British pound, strengthening vs. the shared currency, as delineated by the EUR/GBP sliding 1.19% on Wednesday. The EUR/GBP/ is trading at 0.8745, below its opening price at the time of writing,

EUR/GBP Price Forecast

On Wednesday, the EUR/GBP tumbled below the 20-day EMA, shifting its bias from upwards to neutral-upwards, while the formation of a bearish-engulfing pattern at the end of an uptrend would open the door for further losses. EUR/GBP traders should be aware that the Relative Strength Index (RSI) is neutral, at the 50-midline, almost horizontal, meaning consolidation lies ahead.

The key support levels are the October 4 low at 0.8648, which, once cleared, could open the door for a test of the 50-day EMA at 0.8638. On the flip side, the 20-day EMA at 0.8794 is the first resistance, followed by the 0.8800 figure.

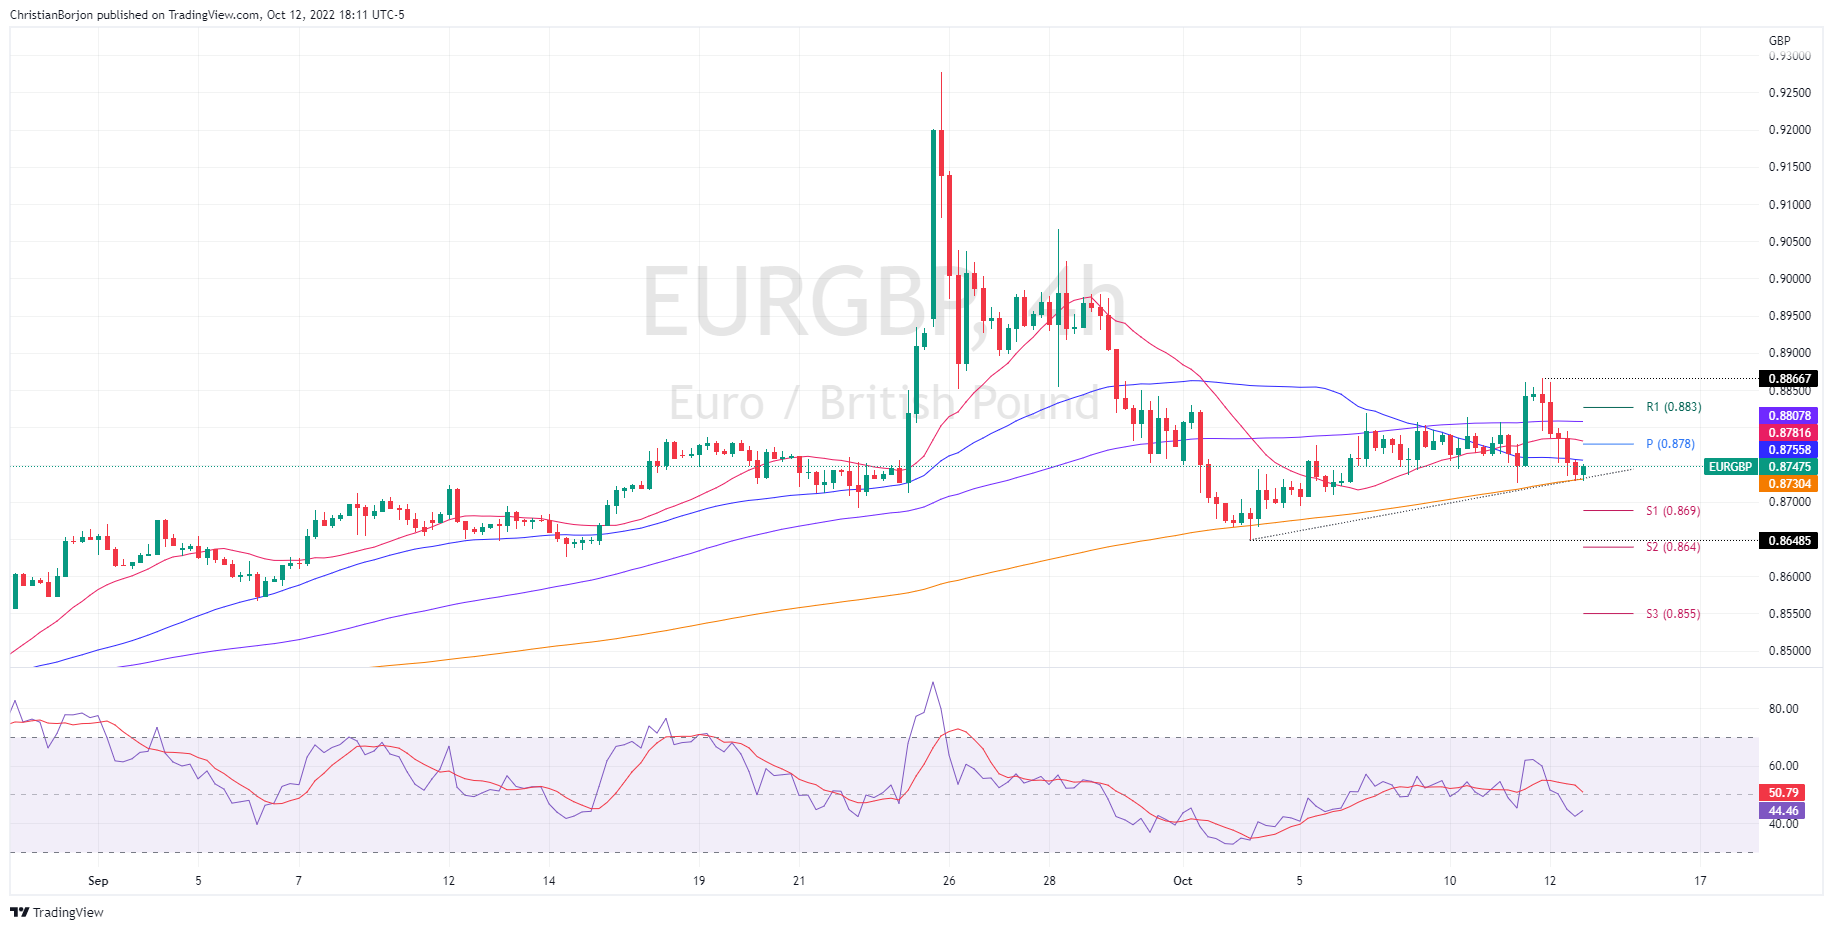
Short term, the EUR/GBP four-hour time frame shows the pair trading above the confluence of the 200-EMA and a two-week upslope support trendline, around 0.8730. If prices tumble below, the EUR/GBP might tumble to the S1 daily pivot around 0.8690, which, once broken, would send the EUR/GBP sliding towards 0.8648, the October 4 low of 0.8648. On the flip side, the intersection of the 20-EMA and the daily pivot point at 0.8780 is the first resistance, followed by the 100-EMA at 0.8807.

EUR/GBP Key Technical Levels

EUR/GBP

Overview
Today last price0.8748
Today Daily Change-0.0103
Today Daily Change %-1.16
Today daily open0.8851
 
Trends
Daily SMA200.8791
Daily SMA500.8628
Daily SMA1000.8576
Daily SMA2000.848
 
Levels
Previous Daily High0.886
Previous Daily Low0.8725
Previous Weekly High0.8831
Previous Weekly Low0.8649
Previous Monthly High0.9254
Previous Monthly Low0.8566
Daily Fibonacci 38.2%0.8809
Daily Fibonacci 61.8%0.8777
Daily Pivot Point S10.8764
Daily Pivot Point S20.8677
Daily Pivot Point S30.8629
Daily Pivot Point R10.8899
Daily Pivot Point R20.8947
Daily Pivot Point R30.9034

Author

Christian Borjon Valencia

Markets analyst, news editor, and trading instructor with over 14 years of experience across FX, commodities, US equity indices, and global macro markets.

More from Christian Borjon Valencia
Share:

Editor's Picks

EUR/USD revisits 1.1780, or daily lows

EUR/USD now comes under further selling pressure, breaking below the 1.1800 support to reach daily troughs on Thursday. The pair’s decline comes in response to a sudden bout of USD strength amid steady geopolitical tensions. Ealier in the day, the ECB’s Lagarde delivered cautious remarks, although the currency remained apathetic.

GBP/USD makes a U-turn, challenges 1.3500

GBP/USD rapidly leaves behind Wednesday’s strong advance, putting the 1.3500 support to the test on Thursday. Cable’s deep pullback follows the strong gains in the Greenback, while investors continue to pencil in a potential BoE rate cut in March.

Gold sticks to the bid bias, flirts with $5,200

Gold is now facing some downside pressure, hovering around the $5,170 region on Thursday. The precious metal adds to Wednesday’s optimism despite the Greenback trades in a firm fashion, although geopolitical tensions in the Middle East keep the yellow metal bid for now.

Stellar: Relief bounce fades as bearish undertone persists

Stellar is trading around $0.16 at the time of writing on Thursday after rebounding more than 8% in the previous day. Derivatives data paints a negative picture as XLM’s short bets hit a monthly high while Open Interest continues to decline.

Changing the game: International implications of recent tariff developments

The Supreme Court ruling on International Emergency Economic Powers Act (IEEPA) tariffs provides limited relief for the rest of the world, with weighted average tariff rates modestly lower.

Bitcoin steadies as traders eye US–Iran talks

Bitcoin (BTC) price is stabilizing around $68,000 at the time of writing on Thursday after a 6.2% relief rally the previous day amid a broader downward trend.