|

EUR/GBP Price Analysis: Consolidation on as the pair awaits directional cues

  • The EUR/GBP cross faced rejection at the crucial 100-day SMA last week, signaling a potential shift in trend.
  • The cross might sideways within a range defined by the 100-day SMA and the 20-day SMA providing support.

The EUR/GBP cross has been exhibiting a sideways trend in recent trading sessions, consolidating within a narrow range. This consolidation phase is likely to continue until a decisive breakout occurs in either direction, providing further guidance on the cross's future trajectory. On Tuesday de cross mildly declined towards the 0.8380 area.

The Relative Strength Index (RSI) is at 55 indicating that buying pressure is declining as is in the positive area and has a mildly declining slope. The Moving Average Convergence Divergence (MACD) is green and decreasing, also suggesting that bullish momentum is waning. 

Overall, the technical indicators suggest that the EUR/GBP cross is in a neutral phase, with both bullish and bearish forces vying for control. A breakout from the current range between the 20 and 100-day Simple Moving Average (SMA) will provide further clarity on the cross's future direction. With some signs of bearish forces emerging, the 20-day SMA at 0.8350 might be set to recieve a visit in the near term.
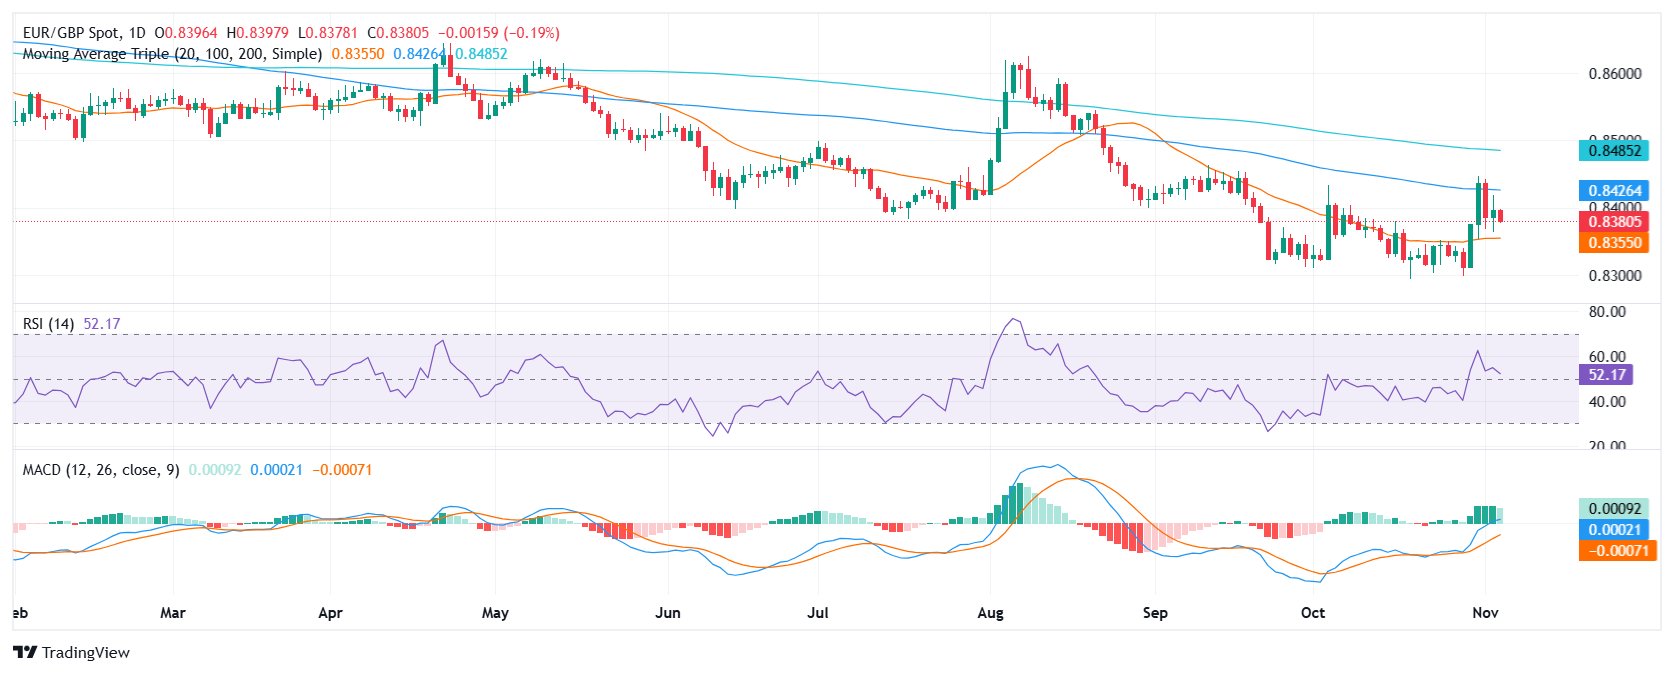
EUR/GBP daily chart

Author

Patricio Martín

Patricio is an economist from Argentina passionate about global finance and understanding the daily movements of the markets.

More from Patricio Martín
Share:

Editor's Picks

EUR/USD slumps below 1.1750 as USD benefits from risk-aversion

EUR/USD comes under renewed bearish pressure in the European session and trades below 1.1750 following a recovery attempt earlier in the day. The US Dollar gathers strength and weighs on the pair as investors seek refuge in the wake of Israel and the United States' joint attack on Iran.

GBP/USD targets 1.3500 barrier near moving averages

GBP/USD rebounds from the daily losses, trading around 1.3450 during the Asian hours on Monday. The technical analysis of the daily chart indicates an ongoing bearish bias, as the pair trades within a descending channel pattern.

Gold surges on safe-haven demand, rises above $5,400

Gold benefits from intense risk-aversion on Monday and climbs above $5,400, setting a fresh monthly-high in the process. Tensions in the Middle East remain high as Israel and Hezbollah continue to exchange strikes following the US-Israel joint attack on Iran over the weekend.

Bitcoin, Ethereum and Ripple under pressure as key supports face breakdown risk

Bitcoin, Ethereum, and Ripple prices trade on the back foot at the start of this week on Monday, after extending losses in the previous week. BTC is on the brink of a breakdown, ETH is capped below key resistance, and XRP risks a crack of the trendline.

The market is paying for insurance, not apocalypse

As expected, this morning felt less like a Monday market open and more like a fire drill. Futures screens flickered red. S&P contracts down almost 1%. Nasdaq off 1.2%. Brent leaped 13% through $80. Gold rose 1.6% toward $5350 before paring some gains. The dollar is strutting mildly. The Swiss franc is quietly doing what it always does in a storm, catching some safe-haven flows.

Pi Network Price Forecast: Core team offloads supply, weighing on PI recovery

Pi Network  hovers below $0.1700, broadly steady at press time on Monday, attempting a recovery after a 2% loss the previous day. Sunday’s decline aligned with nearly 49 million PI tokens offloaded by the Pi Foundation, implying a spike in supply pressure that capped the prevailing four-day recovery.