|

EUR/GBP Price Analysis: Climbs after hitting YTD low below 0.8500, oscillates around 0.8540s

  • EUR/GBP rebounds from a YTD low of 0.8492 to trade at 0.8542, gaining 0.28%, but remains below crucial moving averages.
  • The intraday outlook is neutral; a daily close above the August 22 high of 0.8545 could signal a move toward 0.8600.
  • Sellers could target the 0.8500 level if the pair closes below 0.8545; further downside is expected below that mark.

EUR/GBP currency pair is showing a neutral to downward bias as it hovers below both the 50 and 200-day Moving Averages (DMAs), according to the daily chart. Despite hitting a new year-to-date low of 0.8492, the pair saw buyers step in to reclaim the 0.8500 level, sparking a modest recovery towards the current exchange rate at around 0.8542, for a gain of 0.28%.

EUR/GBP Price Analysis: Technical outlook

The EUR/GBP daily chart portrays the pair as neutral to downward biased, with the EUR/GBP standing below the 50 and 200-day Moving Averages (DMAs). It should be noted the cross printed a new year-to-date (YTD) low of 0.8492, but buyers moved in and reclaimed the 0.8500 figure, spurring a recovery toward the 0.8540 area.

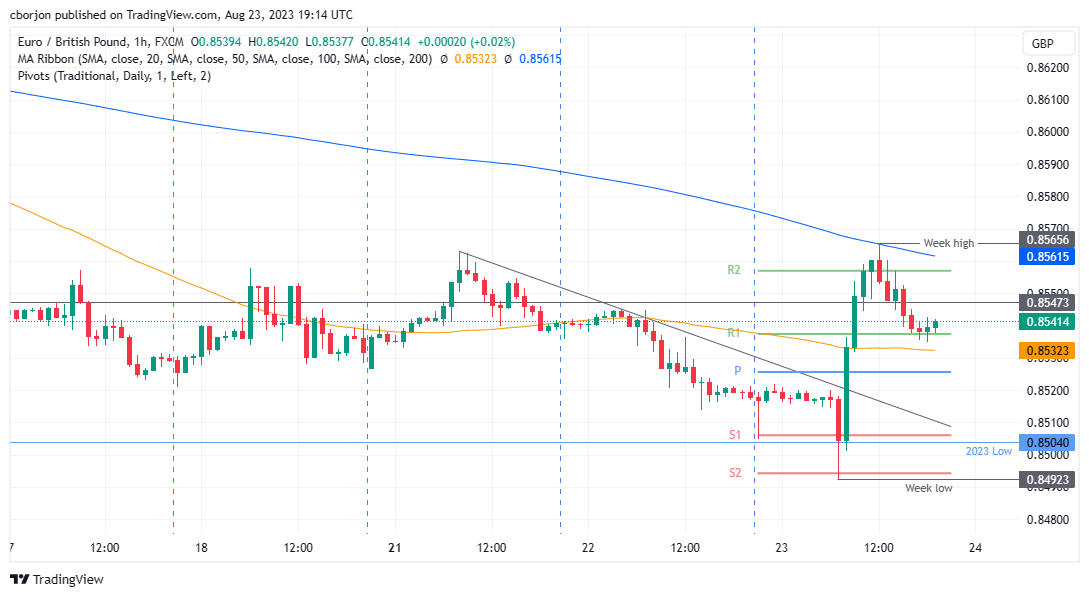
From an intraday perspective, the EUR/GBP hourly chart is neutral-biased, but it could turn upwards if it achieves a daily close above the August 22 daily high of 0.8545. Once done, the EUR/GBP could test the 200-hour Moving Average (HMA) at 0.8561, followed by the current week’s high of 0.8565. A breach of the latter could test the 0.8600 level.

Otherwise, if EUR/GBP registers a daily close below 0.8545, sellers could eye a test of the 0.8500 mark. Further downside is expected below that level.

EUR/GBP Price Action – Hourly chart

EUR/GBP

Overview
Today last price0.8539
Today Daily Change0.0021
Today Daily Change %0.25
Today daily open0.8518
 
Trends
Daily SMA200.8586
Daily SMA500.8583
Daily SMA1000.8653
Daily SMA2000.8717
 
Levels
Previous Daily High0.8546
Previous Daily Low0.8514
Previous Weekly High0.8633
Previous Weekly Low0.8524
Previous Monthly High0.8701
Previous Monthly Low0.8504
Daily Fibonacci 38.2%0.8526
Daily Fibonacci 61.8%0.8533
Daily Pivot Point S10.8506
Daily Pivot Point S20.8494
Daily Pivot Point S30.8474
Daily Pivot Point R10.8538
Daily Pivot Point R20.8558
Daily Pivot Point R30.857
 

Author

Christian Borjon Valencia

Markets analyst, news editor, and trading instructor with over 14 years of experience across FX, commodities, US equity indices, and global macro markets.

More from Christian Borjon Valencia
Share:

Editor's Picks

EUR/USD drops below 1.1600 on broad USD strength

EUR/USD stays under bearish pressure and trades at a fresh six-week low below 1.1600 on Tuesday. Despite stronger-than-forecast inflation data from the Eurozone, the pair struggles to stage a rebound as the US Dollar continues to attract safe haven flows amid escalating geopolitical tensions in the Middle East. 

GBP/USD attacks 1.3300, refreshing three-month lows

GBP/USD is deep in the red near 1.3300, accelerating its downside to renew three-month lows in European trading on Tuesday. The ongoing escalation in the Iran war, combined with rising Oil prices, weighs negatively on the higher-yielding Pound Sterling as the US Dollar capitalizes on increased haven demand.

Gold drops below $5,200 on stronger USD, rallying US yields

Gold attracts some intraday selling and falls below $5,200 on Tuesday. The US Dollar climbs to a fresh high since January 20 and turns out to be a key factor exerting downward pressure on the commodity. Meanwhile, the benchmark 10-year US Treasury bond yield rises nearly 2% on the day, putting additional weight on XAU/USD's shoulders.

Crypto Today: Bitcoin, Ethereum, XRP pull back as sentiment remains in extreme market fear

The cryptocurrency market is broadly in the red on Tuesday as the Middle East grapples with an escalating war. Bitcoin (BTC) is in a pullback, trading below $67,000 at the time of writing, and most altcoins follow suit.

Middle East conflict ramps up a gear as energy price spike rips through markets

It’s another risk off day as geopolitical headwinds continue to batter financial markets. Although markets calmed during the US session and US stocks managed to post gains on Monday, this has not fed through to the European session, and stocks and bonds are sharply lower for a second day.

Hyperliquid Price Forecast: HYPE rises on commodities demand amid US-Iran war

Hyperliquid (HYPE) steadies above $33 at press time on Tuesday, marking its fourth consecutive day of recovery in a broadly volatile market due to the ongoing US-Israel strikes on Iran.