EUR/GBP Price Analysis: Bears poke 0.8800, Head and Shoulders in the offing


  • EUR/GBP prints three-day downtrend, stays pressed near intraday low.
  • Sustained trading below 100-HMA teases confirmation of head and shoulders bearish chart formation.
  • One-week-old ascending trend line can act as buffer on the way to 0.8670.
  • Buyers remain off the table below 0.8865 hurdle.

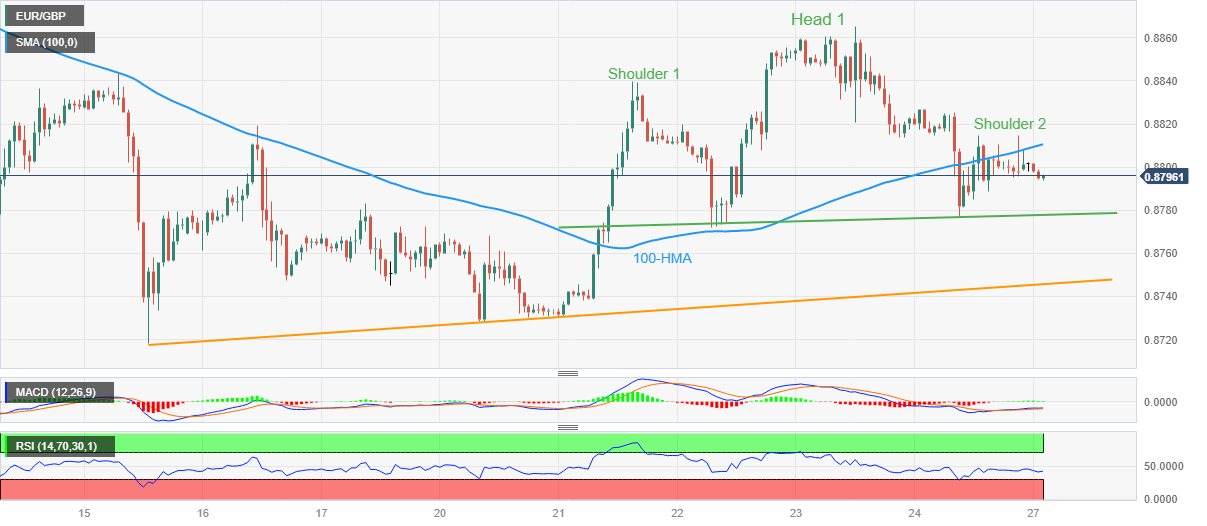
EUR/GBP slides to 0.8795 during early Monday, printing a three-day downtrend amid a sluggish start to the week. In doing so, the cross-currency pair stays below the 100-Hour Moving Average (HMA) while justifying downbeat MACD and RSI.

It’s worth noting that the EUR/GBP pair portrays head and shoulders bearish chart formation on the hourly play amid the aforementioned signals, namely downbeat oscillators and sustained trading below the 100-HMA, favor sellers.

That said, the quote’s further downside hinges on a clear break of the stated bearish chart formation’s neckline, close to 0.8775 by the press time.

Following that, an ascending support line from March 15, close to 0.8745, may act as an intermediate halt during the theoretical fall targeting 0.8670. Also acting as the downside filter is the monthly low of around 0.8715.

Alternatively, recovery moves need successful trading beyond the 100-HMA level of 0.8810 to recall the EUR/GBP bulls.

Even so, the recent tops surrounding 0.8865 and the 0.8900 round figure could challenge the pair buyers afterward.

If at all the EUR/GBP stays firmer past 0.8900, the monthly high near 0.8925 may act as the last defense of the bears.

EUR/GBP: Hourly chart

Trend: Further downside expected

Additional important levels

Overview
Today last price 0.8796
Today Daily Change -0.0002
Today Daily Change % -0.02%
Today daily open 0.8798
 
Trends
Daily SMA20 0.8827
Daily SMA50 0.8833
Daily SMA100 0.8779
Daily SMA200 0.8689
 
Levels
Previous Daily High 0.8827
Previous Daily Low 0.8777
Previous Weekly High 0.8866
Previous Weekly Low 0.8728
Previous Monthly High 0.8979
Previous Monthly Low 0.8755
Daily Fibonacci 38.2% 0.8796
Daily Fibonacci 61.8% 0.8808
Daily Pivot Point S1 0.8774
Daily Pivot Point S2 0.8751
Daily Pivot Point S3 0.8725
Daily Pivot Point R1 0.8824
Daily Pivot Point R2 0.885
Daily Pivot Point R3 0.8874


Share: Feed news

Information on these pages contains forward-looking statements that involve risks and uncertainties. Markets and instruments profiled on this page are for informational purposes only and should not in any way come across as a recommendation to buy or sell in these assets. You should do your own thorough research before making any investment decisions. FXStreet does not in any way guarantee that this information is free from mistakes, errors, or material misstatements. It also does not guarantee that this information is of a timely nature. Investing in Open Markets involves a great deal of risk, including the loss of all or a portion of your investment, as well as emotional distress. All risks, losses and costs associated with investing, including total loss of principal, are your responsibility. The views and opinions expressed in this article are those of the authors and do not necessarily reflect the official policy or position of FXStreet nor its advertisers. The author will not be held responsible for information that is found at the end of links posted on this page.

If not otherwise explicitly mentioned in the body of the article, at the time of writing, the author has no position in any stock mentioned in this article and no business relationship with any company mentioned. The author has not received compensation for writing this article, other than from FXStreet.

FXStreet and the author do not provide personalized recommendations. The author makes no representations as to the accuracy, completeness, or suitability of this information. FXStreet and the author will not be liable for any errors, omissions or any losses, injuries or damages arising from this information and its display or use. Errors and omissions excepted.

The author and FXStreet are not registered investment advisors and nothing in this article is intended to be investment advice.

Recommended content


Recommended content

Editors’ Picks

AUD/USD risks a deeper drop in the short term

AUD/USD risks a deeper drop in the short term

AUD/USD rapidly left behind Wednesday’s decent advance and resumed its downward trend on the back of the intense buying pressure in the greenback, while mixed results from the domestic labour market report failed to lend support to AUD.

AUD/USD News

EUR/USD leaves the door open to a decline to 1.0600

EUR/USD leaves the door open to a decline to 1.0600

A decent comeback in the Greenback lured sellers back into the market, motivating EUR/USD to give away the earlier advance to weekly tops around 1.0690 and shift its attention to a potential revisit of the 1.0600 neighbourhood instead.

EUR/USD News

Gold is closely monitoring geopolitics

Gold is closely monitoring geopolitics

Gold trades in positive territory above $2,380 on Thursday. Although the benchmark 10-year US Treasury bond yield holds steady following upbeat US data, XAU/USD continues to stretch higher on growing fears over a deepening conflict in the Middle East.

Gold News

Bitcoin price shows strength as IMF attests to spread and intensity of BTC transactions ahead of halving

Bitcoin price shows strength as IMF attests to spread and intensity of BTC transactions ahead of halving

Bitcoin (BTC) price is borderline strong and weak with the brunt of the weakness being felt by altcoins. Regarding strength, it continues to close above the $60,000 threshold for seven weeks in a row.

Read more

Is the Biden administration trying to destroy the Dollar?

Is the Biden administration trying to destroy the Dollar?

Confidence in Western financial markets has already been shaken enough by the 20% devaluation of the dollar over the last few years. But now the European Commission wants to hand Ukraine $300 billion seized from Russia.

Read more

Forex MAJORS

Cryptocurrencies

Signatures