|

EUR/GBP Price Analysis: Ascensds above 0.8550 on risk-on, as it pierces the 50-DMA

  • EUR/GBP trades at 0.8585, testing the 50-day Moving Average at 0.8583, with a daily close above potentially targeting the 0.8600 level.
  • Hourly chart shows an upward bias as the pair forms a series of higher lows and higher highs, setting the stage for further gains.
  • A breach below the 50-hour SMA at 0.8579 could trigger a pullback, with potential downside targets including Monday’s low of 0.8566 and last Friday’s low of 0.8560.

EUR/GBP climbed late in the New York session to gains above 0.8550, courtesy of a risk-on impulse and technical indicator, suggesting further upside is expected amid the lack of economic data on the UK calendar. The pair is trading at 0.8585, gains 0.11%.

EUR/GBP Price Analysis: Technical outlook

The cross-currency daily chart portrays the pair as neutral to downward biased, as the pair resumed upwards and is testing the 50-day Moving Average (DMA) at 0.8583. A daily close above the latter would expose the 0.8600 figure, followed by the August 14 high of 0.8632. Otherwise, if EUR/GBP stays below 0.8600, that could open the door for further weakness, and it might test the year-to-date (YTD) low of 0.8492.

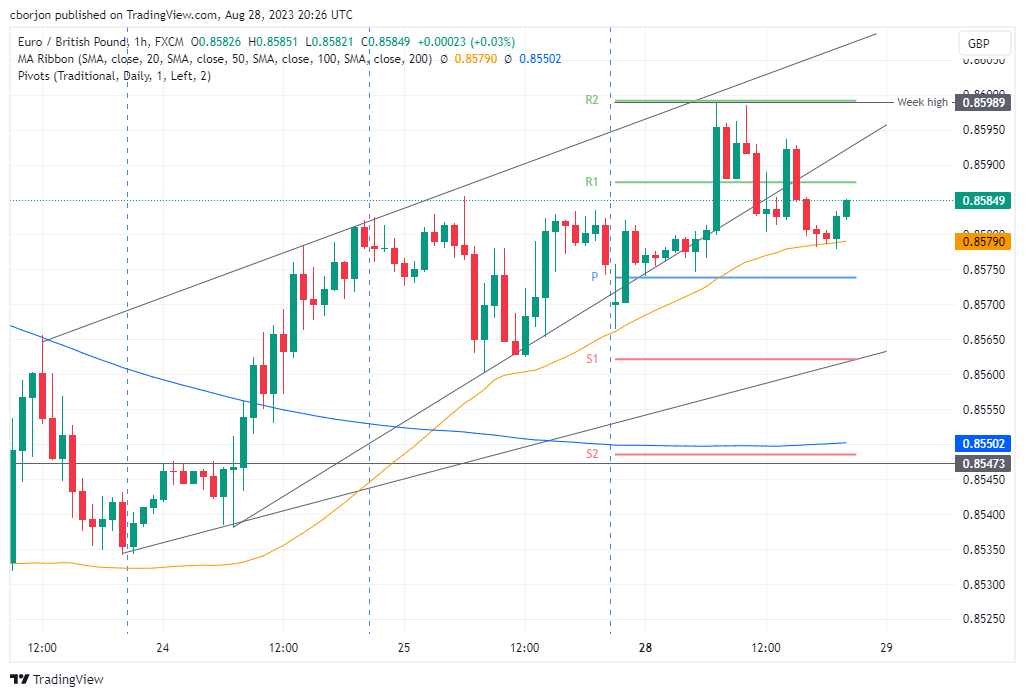
The EUR/GBP hourly chart depicts the pair as upward biased, with the pair achieving successive series of higher lows and higher highs, which could pave the way for further upside. If EUR/GBP  breaks above 0.8600, that could open the door for further gains, with the August 14 high at 0.8632 and the August 11 high at 0.8669. Conversely, if sellers break the 50-hour Simple Moving Average (SMA) ah 0.8579, a pullback is expected towards Monday’s low of 0.8566. A breach of the latter would expose last Friday’s low of 0.8560.

EUR/GBP Price Action – Hourly chart

EUR/GBP Hourly chart

EUR/GBP

Overview
Today last price0.8584
Today Daily Change0.0003
Today Daily Change %0.03
Today daily open0.8581
 
Trends
Daily SMA200.8584
Daily SMA500.8584
Daily SMA1000.8647
Daily SMA2000.8715
 
Levels
Previous Daily High0.8586
Previous Daily Low0.856
Previous Weekly High0.8586
Previous Weekly Low0.8493
Previous Monthly High0.8701
Previous Monthly Low0.8504
Daily Fibonacci 38.2%0.8576
Daily Fibonacci 61.8%0.857
Daily Pivot Point S10.8566
Daily Pivot Point S20.8551
Daily Pivot Point S30.8541
Daily Pivot Point R10.8591
Daily Pivot Point R20.8601
Daily Pivot Point R30.8616
 

Author

Christian Borjon Valencia

Christian Borjon began his career as a retail trader in 2010, mainly focused on technical analysis and strategies around it. He started as a swing trader, as he used to work in another industry unrelated to the financial markets.

More from Christian Borjon Valencia
Share:

Markets move fast. We move first.

Orange Juice Newsletter brings you expert driven insights - not headlines. Every day on your inbox.

By subscribing you agree to our Terms and conditions.

Editor's Picks

EUR/USD moves sideways below 1.1800 on Christmas Eve

EUR/USD struggles to find direction and trades in a narrow channel below 1.1800 after posting gains for two consecutive days. Bond and stock markets in the US will open at the usual time and close early on Christmas Eve, allowing the trading action to remain subdued. 

GBP/USD keeps range around 1.3500 amid quiet markets

GBP/USD keeps its range trade intact at around 1.3500 on Wednesday. The Pound Sterling holds the upper hand over the US Dollar amid pre-Christmas light trading as traders move to the sidelines heading into the holiday season. 

Gold retreats from record highs, trades below $4,500

Gold retreats after setting a new record-high above $4,520 earlier in the day and trades in a tight range below $4,500 as trading volumes thin out ahead of the Christmas break. The US Dollar selling bias remains unabated on the back of dovish Fed expectations, which continues to act as a tailwind for the bullion amid persistent geopolitical risks.

Bitcoin slips below $87,000 as ETF outflows intensify, whale participation declines

Bitcoin price continues to trade around $86,770 on Wednesday, after failing to break above the $90,000 resistance. US-listed spot ETFs record an outflow of $188.64 million on Tuesday, marking the fourth consecutive day of withdrawals.

Economic outlook 2026-2027 in advanced countries: Solidity test

After a year marked by global economic resilience and ending on a note of optimism, 2026 looks promising and could be a year of solid economic performance. In our baseline scenario, we expect most of the supportive factors at work in 2025 to continue to play a role in 2026.

Avalanche struggles near $12 as Grayscale files updated form for ETF

Avalanche trades close to $12 by press time on Wednesday, extending the nearly 2% drop from the previous day. Grayscale filed an updated form to convert its Avalanche-focused Trust into an ETF with the US Securities and Exchange Commission.