|

EUR/GBP falling back from 0.8700 as markets gear up for EU CPI, UK GDP

  • EUR/GBP backed down to 0.8660 on Wednesday.
  • Economic calendar kicks off the end-week with EU CPI & UK GDP figures for Friday.
  • Thursday to see the ECB's latest economic bulletin and September Consumer Confidence.

The EUR/GBP pulled back from recent highs to settle into 0.8660 after reaching a session peak of 0.8706.

The Euro (EUR) couldn't hang onto gains against the Pound Sterling (GBP) and lost the 0.8700 handle as markets gear up for the Thursday trading session.

The upcoming European market session will see the European Central Bank (ECB) drop their latest Economic Bulletin, which is published two weeks after each Governing Council meeting. Investors will find finer details of what the ECB discussed at the latest meeting, though market impact is likely to be limited after the ECB struck a notably dovish tone at their last meet.

The ECB has backed away from rate increases for the time being, and with the European economy on shaky ground it is unlikely that the central bank will be planning additional rate hikes any time soon.

Friday data dump sees EU CPI & UK GDP

Thursday will also see EU Consumer Confidence figures for September, and markets are forecasting the print to match the previous month's release at -17.8 as European consumers continue to fear growing recession conditions within the EU.

Friday kicks off a bumper economic calendar docket with UK Gross Domestic Product (GDP) figures at 06:00 GMT, and second-quarter GDP growth is expected to hold steady with the previous print of 0.2%.

EU Consumer Price Index (CPI) inflation numbers will be dropping on Friday at 09:00 GMT, and markets are forecasting the annualized September CPI inflation reading to clock in a half-percent decline from 5.3% to 4.8%.

EUR/GBP technical outlook

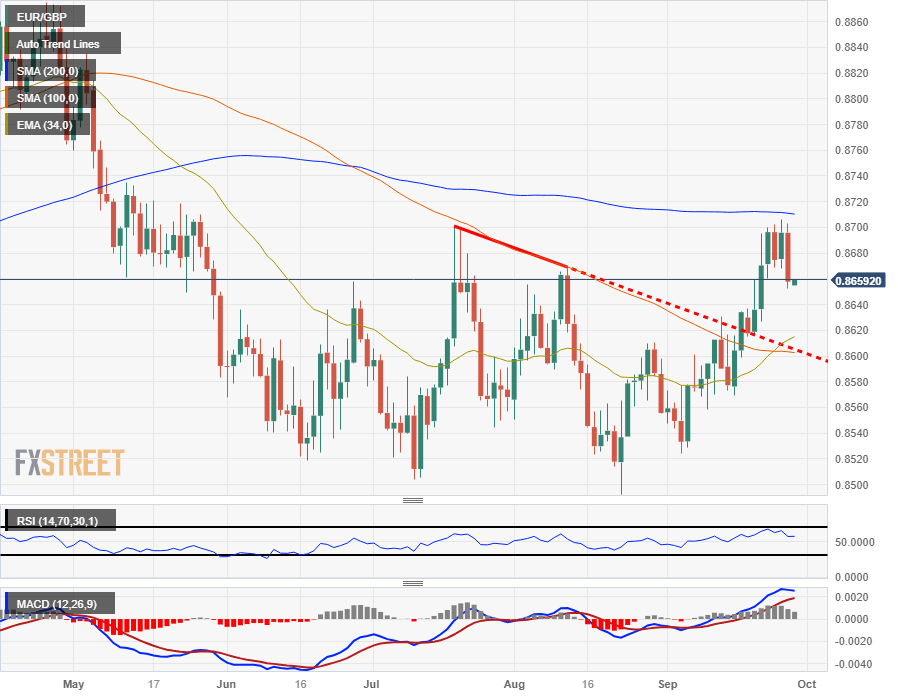
The EUR/GBP has slipped back to the 0.8660 level in intraday trading after losing the day's high above 0.8700, and daily candlesticks see the pair facing a rejection from the 200-day Simple Moving Average (SMA) in the near-term, currently pricing in near 0.8710.

The EUR/GBP is up over 1.5% from the last swing low into 0.8530, breaking cleanly through the descending trendline from July's failed run at the 0.8700 handle, a level that looks set to continue providing technical resistance as the Euro-Pound Sterling pair struggles to find long-term momentum.

EUR/GBP daily chart

EUR/GBP technical levels

EUR/GBP

Overview
Today last price0.8658
Today Daily Change-0.0038
Today Daily Change %-0.44
Today daily open0.8696
 
Trends
Daily SMA200.8606
Daily SMA500.8598
Daily SMA1000.8604
Daily SMA2000.8712
 
Levels
Previous Daily High0.8706
Previous Daily Low0.8668
Previous Weekly High0.87
Previous Weekly Low0.8599
Previous Monthly High0.8669
Previous Monthly Low0.8493
Daily Fibonacci 38.2%0.8692
Daily Fibonacci 61.8%0.8683
Daily Pivot Point S10.8674
Daily Pivot Point S20.8652
Daily Pivot Point S30.8636
Daily Pivot Point R10.8712
Daily Pivot Point R20.8728
Daily Pivot Point R30.875

Author

Joshua Gibson

Joshua joins the FXStreet team as an Economics and Finance double major from Vancouver Island University with twelve years' experience as an independent trader focusing on technical analysis.

More from Joshua Gibson
Share:

Markets move fast. We move first.

Orange Juice Newsletter brings you expert driven insights - not headlines. Every day on your inbox.

By subscribing you agree to our Terms and conditions.

Editor's Picks

EUR/USD meets some support near 1.1670

EUR/USD further extends its bearish leg on Wednesday, coming under extra pressure and breaching below the 1.1700 level to flirt with four-week troughs in a context of marginal gains in the US Dollar ahead of the key US NFP on Friday.

GBP/USD consolidates above mid-1.3400s; bullish potential seems intact

The GBP/USD pair is seen consolidating its heavy losses registered over the past two days and oscillating in a narrow trading band, just above mid-1.3400s during the Asian session on Thursday. However, the fundamental backdrop warrants some caution for bearish traders and before positioning for an extension of the retracement slide from the 1.3565-1.3570 region, or the highest level since September 18, touched on Tuesday.

Gold remains offered near $4,450

Gold remains on the back foot on Wednesday, hovering around $4,450 per troy ounce after bringing a three-day rally to an end. The metal’s advance seems to have run out of steam near the $4,500 area, with a firmer US Dollar after key US data weighing on prices. Still, the downside looks limited for now, thanks to falling US Treasury yields across the curve.

XRP faces selling pressure as key on-chain metric resets and ETF inflows weaken

Ripple (XRP) is trading downward but holding support at $2.22 at the time of writing on Wednesday, as fear spreads across the cryptocurrency market, reversing gains made from the start of the year.

2026 economic outlook: Clear skies but don’t unfasten your seatbelts yet

Most years fade into the background as soon as a new one starts. Not 2025: a year of epochal shifts, in which the macroeconomy was the dog that did not bark. What to expect in 2026? The shocks of 2025 will not be undone, but neither will they be repeated.

XRP battles selling pressure as profit-taking, ETF inflows shape outlook

Ripple (XRP) is trading downward but holding support at $2.22 at the time of writing on Wednesday, as fear spreads across the cryptocurrency market, reversing gains made from the start of the year.