|

EUR/CAD Price Analysis: Probably completing a large Symmetrical Triangle

  • EUR/CAD is completing a Symmetrical Triangle pattern on the weekly chart. 
  • A breakout is expected – probably quite soon – leading to a volatile directional move higher or lower. 
  • Given the move prior to the pattern in 2022-23 was bullish, the odds marginally favor a breakout and continuation higher. 

EUR/CAD is completing a Symmetrical Triangle pattern on the weekly price chart, which indicates the pair is poised to break out and move in a volatile directional fashion. 

EUR/CAD Weekly Chart

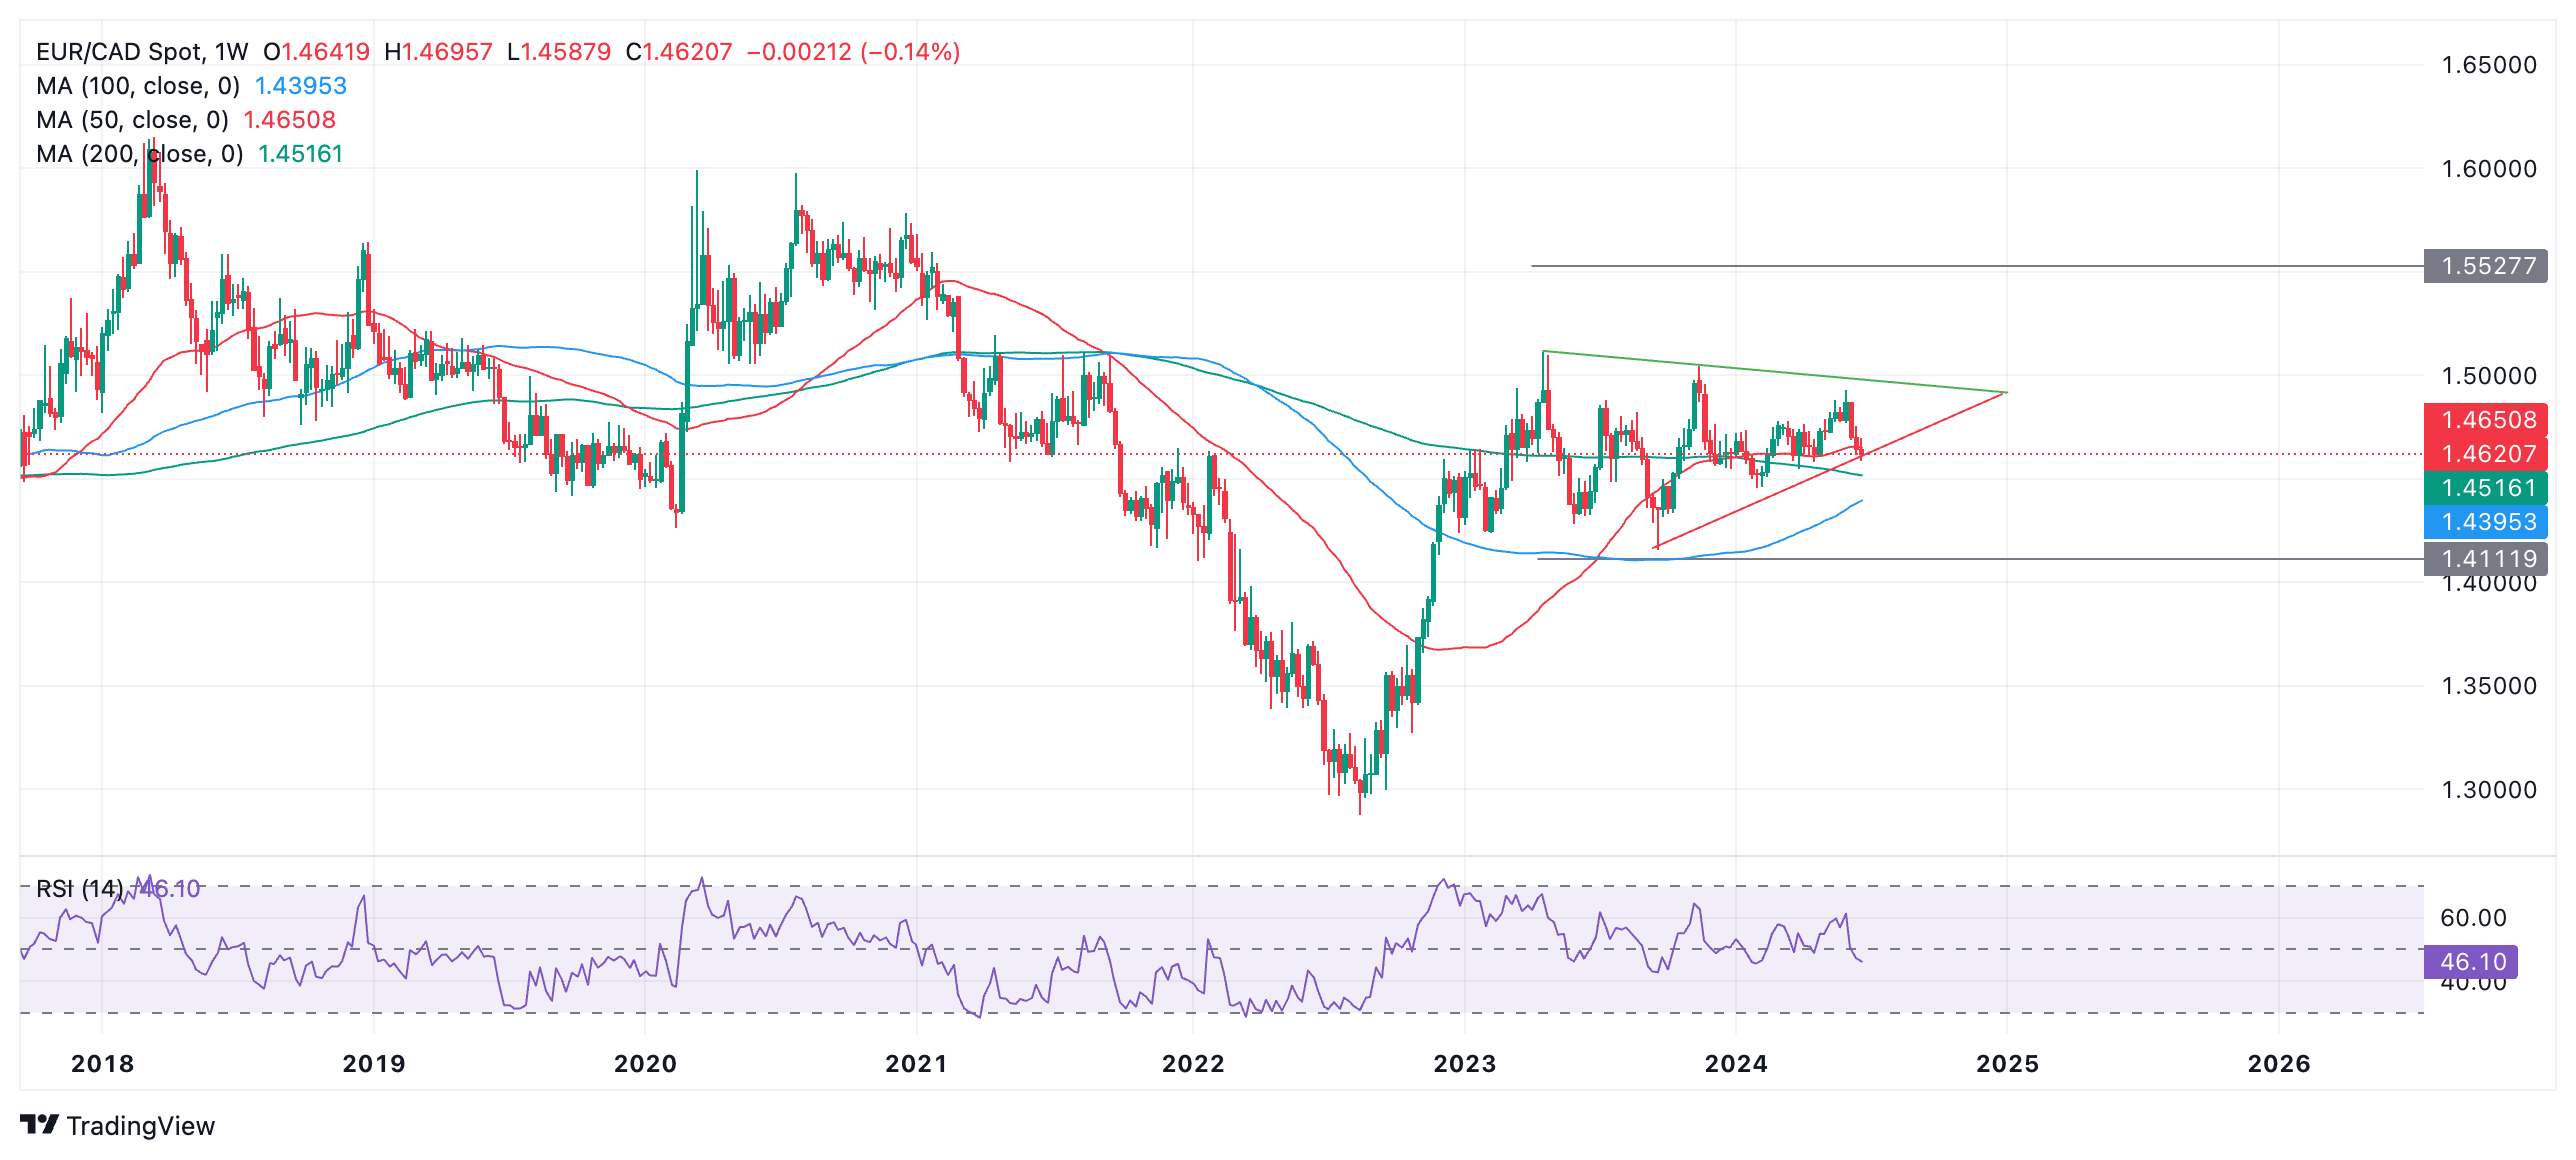
The bigger picture for EUR/CAD is that the pair bottomed out in 2022 and recovered. From the start of 2023 the pair started consolidating and began forming a Symmetrical Triangle pattern. 

The Symmetrical Triangle (ST) pattern has formed roughly five internal waves which is the minimum for reaching completion. It is possible that it has finished, therefore, and could break out quite soon. 

A breakout higher is marginally more likely than a breakout lower because the move prior to the formation of the ST was bullish. It could also be argued that the pair began a long-term uptrend prior to the formation of the ST. 

A decisive break above the upper (green) boundary line would be indicative of an upside breakout. This would be expected to reach a target at roughly 1.5528, the 0.618 Fibonacci of the height of the ST at its widest point extrapolated higher from the breakout point. 

Likewise, the same goes for a decisive break lower, only with a target at roughly 1.4112. 

A decisive break higher would be defined as a breakout that was accompanied by a long, green, weekly candle that closes near its high, or three candles in a row that break higher. In the case of a breakout lower the same would apply only with a red candle instead. 


Author

Joaquin Monfort

Joaquin Monfort is a financial writer and analyst with over 10 years experience writing about financial markets and alt data. He holds a degree in Anthropology from London University and a Diploma in Technical analysis.

More from Joaquin Monfort
Share:

Editor's Picks

AUD/USD stays bid above 0.7100 on Australian trade data, Mideast optimism

AUD/USD clings to minor recovery gains above 0.7100 in the Asian session on Thursday as a new Israel-Lebanon ceasefire keeps a lid on the safe-haven US Dollar. Meanwhile, strong AustralianTrade Balane data also help the Aussie pair sustain the bounce from weekly lows.

USD/JPY hovers near the 160.00 intervention threshold on Mideast tensions

USD/JPY struggles to find acceptance above 160.00 and retreats from a one-month high in the Asian session on Thursday amid fears that authorities will step in again to prop up the Japanese Yen. Furthermore, a new Israel-Lebanon ceasefire caps the US Dollar and supports the currency pair. However, renewed US-Iran tensions keep the downside limited in the Greenback and the pair.

Gold rebounds from one-week low as Israel-Lebanon truce pressures safe-haven USD

Gold gains some positive traction on Thursday and climbs to the $4,475 area during the Asian session, reversing a major part of the previous day's slide to a one-week low. The Israel-Lebanon truce prompts some profit-taking around the US Dollar and supports the commodity. 


Ethereum: Long-term holders' capitulation drives ETH below $1,800

Ethereum has fallen below $1,800 on Wednesday, the first time since May 2025 following accelerated spot selling pressure and distributions from long-term holders. The Age Consumed metric, which tracks the movement of previously idle tokens or long-term holders' coins, spiked over the past two days as prices declined, indicating increased selling activity among this cohort.

Kevin Warsh takes the Fed helm: What it means for the US Dollar
The Federal Reserve moves away from the highly predictable "forward guidance" model of the Jerome Powell era to a new “Kevin Warsh environment”, characterized by less communication, more policy surprises, and an increased focus on the Fed's complex balance sheet.
Recession on paper: What really moves the Canadian Loonie now?

Statistics Canada handed the headline writers a gift and the analysts a headache. Real GDP shrank 0.1% on an annualized basis in the first quarter, and with the fourth quarter of 2025 revised down to a 1.0% contraction, that is two negative quarters in a row, the textbook definition of a technical recession and Canada's first since the pandemic.