|

EUR/CAD Price Analysis: Euro steadies near 1.5600 as bulls hold longer-term edge

  • EUR/CAD trades around the 1.5600 zone following a quiet Friday session post-Europe.
  • Bullish structure holds, though short-term momentum indicators remain mixed.
  • Long-term trend indicators favor upside while near-term resistance levels begin to cap price.

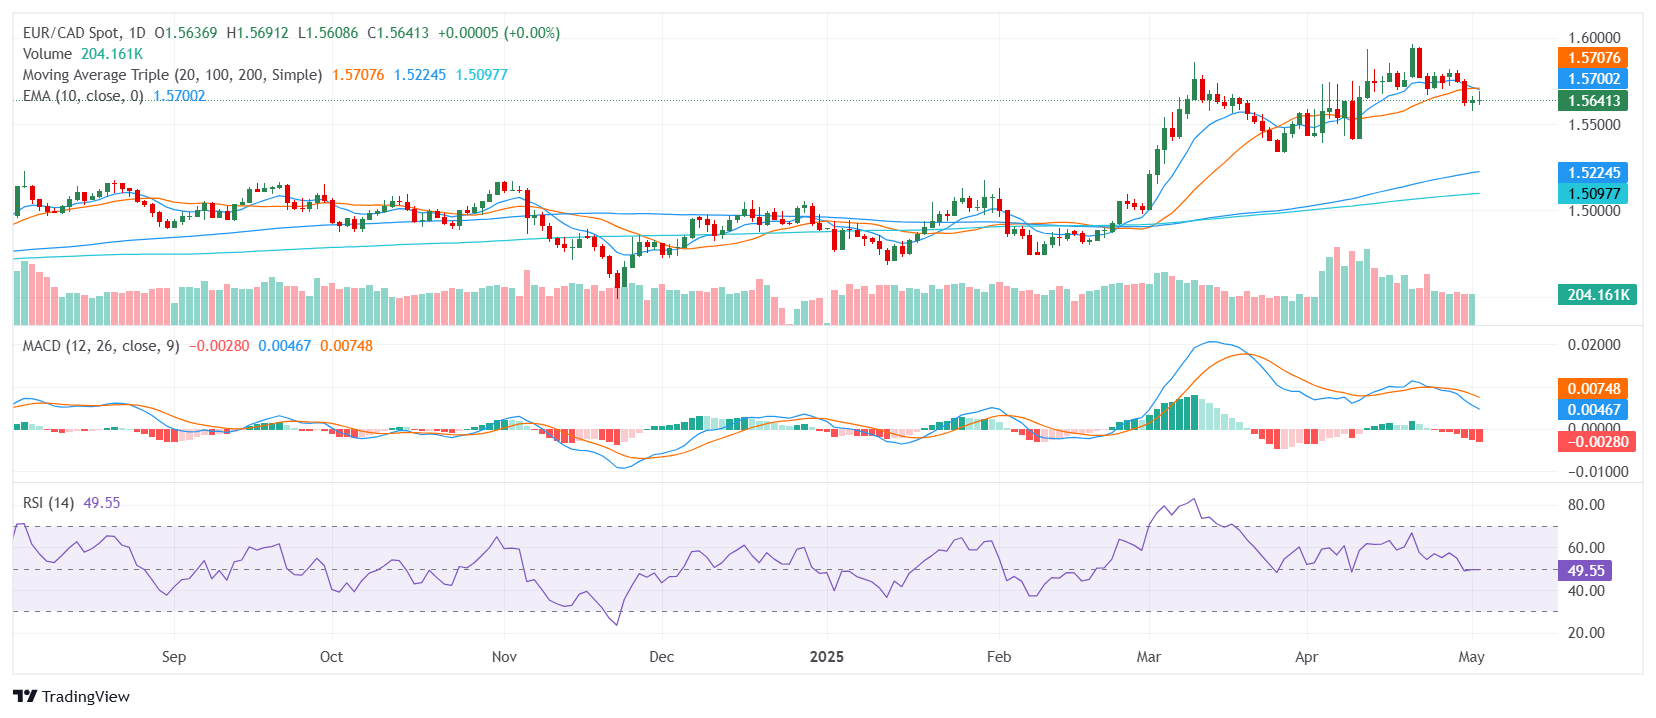
The EUR/CAD pair hovered near the 1.5600 zone on Friday after the European session, showing little change on the day but maintaining a steady bullish bias overall. Price action remains confined to the middle of the daily range, reflecting ongoing consolidation. While short-term signals show hesitation, the broader outlook is supported by strong trend-based indicators positioned below current levels.

From a technical standpoint, EUR/CAD retains a bullish posture, albeit with conflicting signals in the near term. The Relative Strength Index (RSI) sits just below 50, marking a neutral momentum stance. The Moving Average Convergence Divergence (MACD) sends a sell signal, pointing to a potential slowdown in upside drive. Meanwhile, the Stochastic %K and Commodity Channel Index are also neutral, underlining the current consolidation phase.

Trend indicators paint a clearer picture. The 30-day Exponential and Simple Moving Averages both lie just under current price action and maintain an upward slope. Though the 20-day Simple Moving Average stands above spot and signals selling pressure, it remains relatively flat and lacks confirmation from other tools. The longer-term 100-day and 200-day Simple Moving Averages continue to point upward, firmly supporting the pair’s medium-term bullish structure.

Support is seen at 1.5635, 1.5633, and 1.5627. Resistance levels stand at 1.5675, 1.5683, and 1.5686. A break above resistance could reinforce the bullish outlook, while failure to hold support may shift attention back toward the short-term moving averages.

Daily Chart
Author

Patricio Martín

Patricio is an economist from Argentina passionate about global finance and understanding the daily movements of the markets.


More from Patricio Martín
Share:

Editor's Picks

GBP/USD holds range below mid-1.3600s amid Fed risks and Iran tensions

The GBP/USD pair extends its sideways consolidative price move for the second straight day, and trades around the 1.3630 area during the Asian session. The US Dollar is looking to build on its modest recovery from the lowest level since May 14, and is acting as a headwind for the currency pair. The lack of follow-through selling warrants some caution for bearish traders.

EUR/USD gains support amid hawkish ECB expectations, subdued US Dollar

EUR/USD inches higher after posting minor losses in the previous day, trading around 1.1670 during the Asian hours. The pair finds support as rising oil prices, elevated bond yields, and escalating Middle East tensions drive Eurozone inflation concerns. These factors have boosted expectations for a more hawkish stance from the European Central Bank, which is widely anticipated to deliver a 25-basis-point rate hike in September.

$4700 tested as Gold pulls back but bullish potential remains intact
Gold has pulled back sharply from fresh 15-week highs of $4,697, snapping a two-day uptrend in Asia on Tuesday. The US Dollar (USD) holds onto recovery gains, capping further upside in the bullion.
Ripple and Stellar outlook: Key breakouts could fuel the next rally
Ripple (XRP) and Stellar (XLM) are showing signs of renewed strength after rallying over 53% and 27% in the previous week. Meanwhile, both altcoins are approaching key technical levels on Tuesday that could determine their next move. However, mixed on-chain signals with a slight bearish tilt suggest traders remain cautious amid the recent price gains.
Will Jackson Hole ignite Gold and Silver’s next explosive breakout?
The 2026 Jackson Hole Economic Policy Symposium arrives at a pivotal moment. The U.S economy faces record debt, elevated borrowing costs, a weaker dollar and renewed momentum across hard assets. For The Gold & Silver Club, the backdrop increasingly validates its early-year call: “2026 will be the Year of Hard Assets.”
$20 billion offered, $2 billion taken: Why Treasury doubled its buyback cap

The US Treasury moved off its own calendar on Wednesday, and that is the part worth sitting with. At 12:32 GMT, the department said it would at least double the size of liquidity support buyback operations in the 10-year to 20-year and 20-year to 30-year sectors, lifting the maximum from $2 billion per operation to at least $4 billion, effective September 9 and running to November 4.