|

Elliott Wave View: Russell 2000 (RTY) turning lower post FOMC [Video]

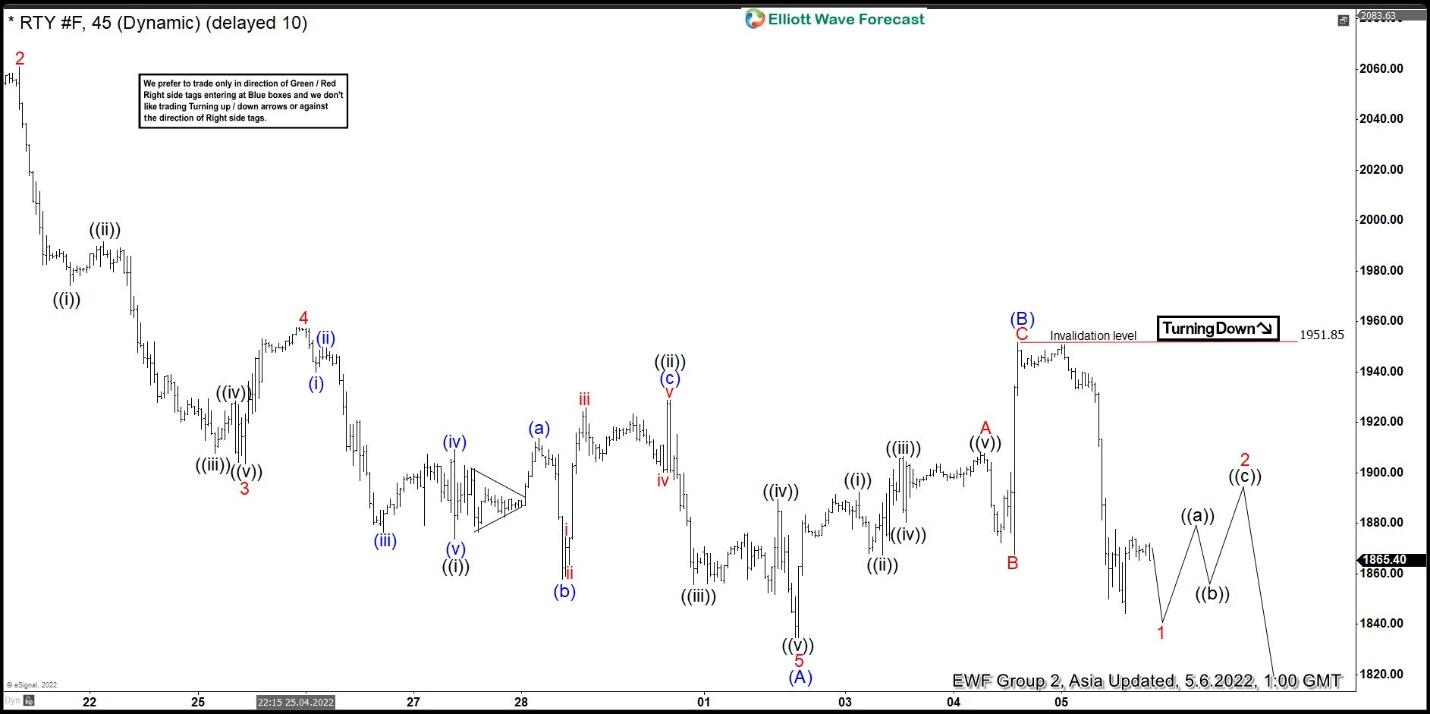
Short Term Elliott Wave View in Russell 2000 (RTY) suggests the decline from March 29, 2022 high is unfolding as a zigzag Elliott Wave structure. Down from March 29 peak, wave 1 ended at 1966.6 and rally in wave 2 ended at 2060.90. Index then resumes lower in wave 3 towards 1903.50 and rally in wave 4 ended at 1957.60. Final leg lower wave 5 ended at 1834.50 which ended wave (A).

Wave (B) rally is proposed complete at 1951.85. However, the Index still needs to break below ave (A) at 1834.50 to validate this view. Internal of wave (B) unfolded as a zigzag in lesser degree. Up from wave (A), wave A ended at 1908.20, pullback in wave B ended at 1867.80 and wave C higher ended at 1951.85. This completed wave (B) in higher degree. Index has turned lower in wave (C). Near term, expect wave 1 to end soon, then Index should rally in wave 2 to correct the decline from wave (B) before it resumes lower. As far as pivot at 1951.85 high stays intact in the first degree, expect rally to fail in the sequence of 3, 7, or 11 swing for further downside.

RTY 45 Minutes Elliott Wave Chart

Russell 2000 Elliott Wave Video

Author

Elliott Wave Forecast Team

Elliott Wave Forecast Team

ElliottWave-Forecast.com

More from Elliott Wave Forecast Team
Share:

Editor's Picks

GBP/USD bounces back to 1.3200 after strong UK Retail Sales data

GBP/USD finds fresh buyers and rebounds to the 1.3200 mark in early Europe on Friday. Stronger-than-expected UK Retail Sales data provide a much-needed lift to the British Pound and the pair amid a chaotic UK political environment.

EUR/USD holds losses below 1.1450 on firmer US Dollar

EUR/USD stays in the red below 1.1450 in the European session on Friday. The pair loses ground as the US Dollar (USD) continues to benefit from the Federal Reserve’s (Fed) hawkish policy outlook and canceled negotiations between the US and Iran in Switzerland.

Gold slumps to one-week low; $4,100 back in sight amid bullish USD

Gold continues losing ground through the Asian session, and touches a fresh weekly trough around the $4,122-$4,121 region in the last hour. The US Dollar retains its bullish bias near the highest level since May 2025 in the face of the US Fed's hawkish tilt, which is seen undermining the non-yielding bullion for the third straight day.

Cardano's Derivatives and on-chain losses compound bearish trend

Cardano (ADA) remains under pressure, trading below $0.165 on Friday, losing over 11% so far this week. Weakening derivatives metrics and deteriorating on-chain data support further correction on ADA. Cardano derivatives metrics support a negative outlook.

 Back above 100: Kevin Warsh’s first Fed meeting sparks US Dollar rally

The US Dollar Index did a phoenix comeback, rising from its ashes and reconquering 100. The reasons behind the US Dollar rally are pretty clear: the Memorandum of Understanding between the United States and Iran, and a hawkish Federal Reserve. Both events were long-awaited and much expected. However, the market reacted with surprise when there were no surprises at all.

The next big AI trade may not be about chips or software

Artificial intelligence has already created some of the biggest winners in modern market history. Chipmakers have surged, data centre construction is booming, and electricity demand forecasts are changing globally.