|

Elliott Wave view: Rally in Russell 2000 (RTY) expected to fail [Video]

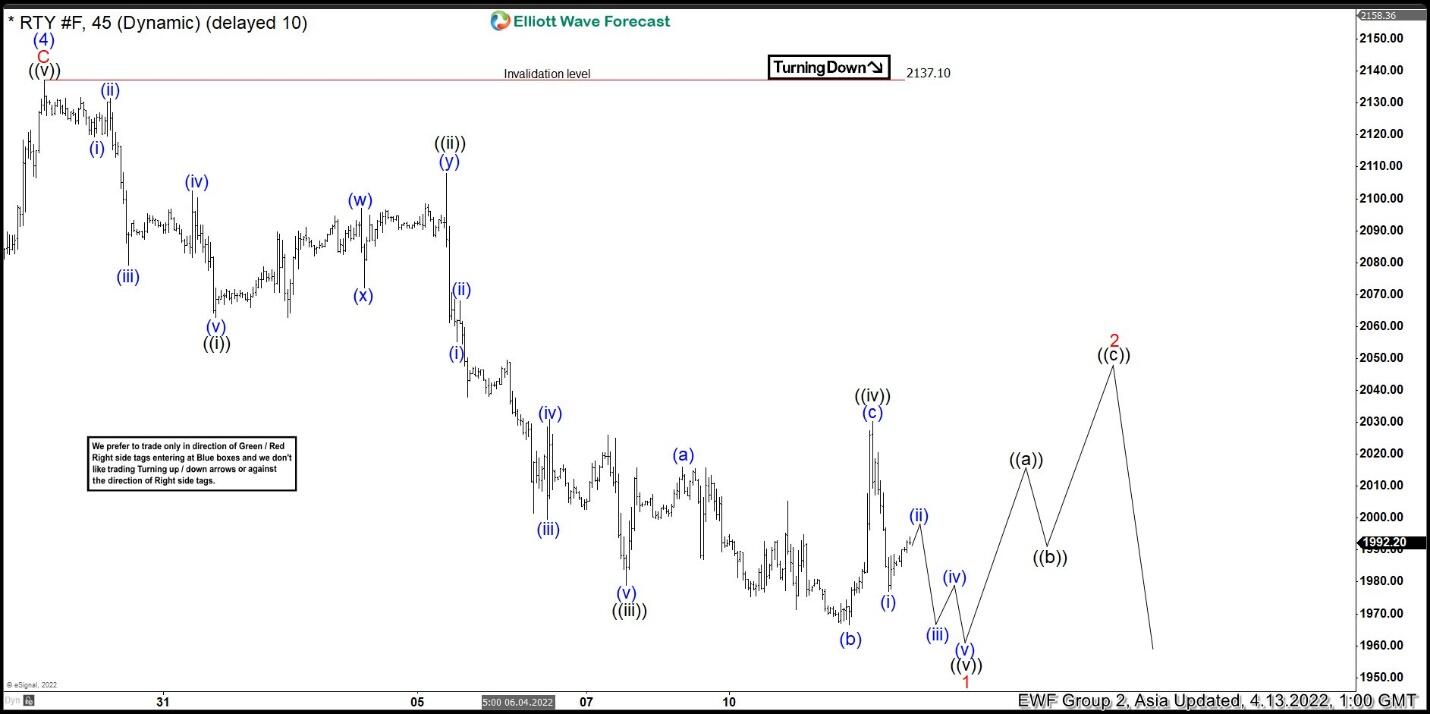
Short term Elliott Wave view in Russell 2000 (RTY) suggests that the decline from November 8, 2021 peak is unfolding as a 5 waves impulse structure. Down from November 8, wave (1) ended at 2136.8 and rally in wave (2) ended at 2288.60. Index then resumes lower in wave (3) towards 1892.40 and wave (4) ended at 2137.10. Wave (5) lower is in progress with the internal subdivision as another impulse in lesser degree. Down from wave (4), wave (i) ended at 2119.30 and wave (ii) rally ended at 2131.60. Index then resumes lower in wave (iii) towards 2079.10, wave (iv) ended at 2102.60, and final wave (v) ended at 2062.80. This completed wave ((i)) in higher degree. Rally in wave ((ii)) ended at 2107.90 with internal subdivision as a double there Elliott Wave structure.

Index then resumes lower in wave ((iii)). Down from wave ((ii)), wave (i) ended at 2055.20 and rally in wave (ii) ended at 2068.10. Index then resumes lower in wave (iii) towards 1999.50, and bounce in wave (iv) ended at 2031. Final leg lower wave (v) ended at 1978.80 which completed wave ((iii)). Bounce in wave ((iv)) ended at 2030.30 with internal subdivision as expanded flat. Up from wave ((iii)), wave (a) ended at 2015.90, wave (b) ended at 1966.60, and wave (c) ended at 2030.30. Expect the Index to extend lower in wave ((v)) before completing wave 1. Afterwards, it should rally in wave 2 to correct cycle from March 30 peak in 3, 7, or 11 swing before the next leg lower.

$RTY 45 minutes Elliott Wave chart

Russell 2000 Elliott Wave video

Author

Elliott Wave Forecast Team

Elliott Wave Forecast Team

ElliottWave-Forecast.com

More from Elliott Wave Forecast Team
Share:

Editor's Picks

AUD/USD falls to near 0.7100 after slipping below 50-day EMA

AUD/USD depreciates after registering minor gains in the previous day, trading around 0.7120 during the Asian hours. The technical analysis of the daily chart shows the pair consolidating sideways within a rectangle pattern, as neither bulls nor bears gain control. The AUD/USD pair is holding a slight bearish tone however as it sits beneath both the nine-day and 50-day EMAs.

160.00: USD/JPY back near intervention territory after upbeat US jobs report

US Nonfarm Payrolls beat expectations by a wide margin in May, with 172K jobs added. The US Dollar rebounds after the release, helping USD/JPY recover from its intraday lows. Warnings from Japanese authorities continue to limit upside potential near the 160.00 threshold.

Gold targets $4,300 amid stronger Dollar

Gold faces increasing selling interest and navigates the area of three-month lows near the $4,300 mark per troy ounce on Friday. The precious metal’s decline comes as traders assess the stronger-than-expected NFP, while the bid bias in the Greenback and higher US Treasury yields also collaborate with the retracement.

Cardano hits five-year low even as Hoskinson clarifies "break" isn't an exit

Cardano (ADA) price is down 10% at press time on Friday, extending losses over 30% so far this week amid Charles Hoskinson's clarification that "break" isn't an exit.

Week ahead – Fed countdown begins amid US inflation data and geopolitical risks

Fed Chair Warsh’s first meeting approaches as key US inflation data could reshape expectations. Oil prices remain elevated as US-Iran talks continue; tariffs also return to the spotlight. ECB is expected to hike; will it be a one-off move or is July live?

The US economy defies the rules: 100 days into the Oil shock and the recession signal is still missing

More than three months after the start of the Iran war and the resulting disruption to global energy markets, the US economy continues to display remarkable resilience. The conflict has triggered a sharp rise in Oil prices, reignited inflationary pressures and fueled widespread concerns about a potential economic slowdown.