Elliott Wave signals caution for TRV: Is a correction looming?

The Travelers Companies, Inc. (TRV) stands strong in the insurance sector. Analysts value its stable earnings, solid dividend, and consistent buybacks. Out of 17 expert ratings, 8 recommend buying, while 7 suggest holding. Only 2 advise selling. The average price target is $294.47, implying an 11% upside from the current $264.87. BMO and KBW raised their targets to $316, citing strong underwriting and pricing power.
However, not all experts agree. Morgan Stanley and Wells Fargo maintain hold ratings due to valuation concerns and catastrophe risks. Barclays recently downgraded TRV, reflecting caution amid market volatility. Despite mixed views, TRV remains a defensive favorite. Its resilience and shareholder-friendly strategy continue to attract long-term investors.
Elliott Wave outlook: TRV weekly chart April 2025
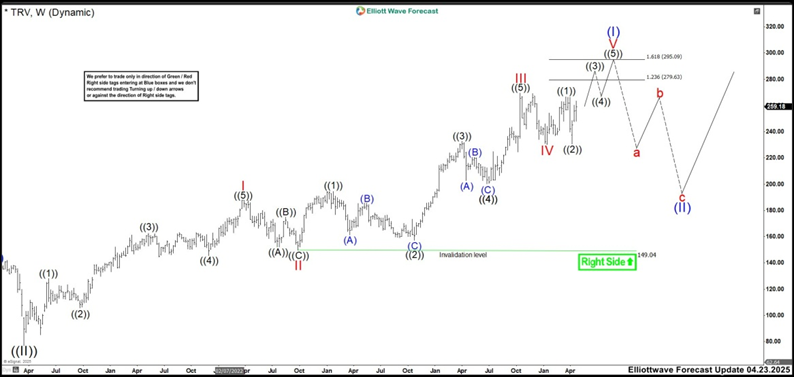
In the latest update, we clearly identified the structure of wave V. Wave ((1)) peaked at 266.74. Then, wave ((2)) corrected sharply to 230.43 but remained above wave IV. After that, TRV moved higher, targeting the 279.63–295.10 zone. This area marks the likely end of wave V of (I) and signals the possible start of wave (II).
However, if the market showed no strong pullback at those levels, wave V might have extended into wave ((3)). TRV would need to push above 300 to confirm a continuation of the bullish momentum.
Elliott Wave outlook: TRV weekly chart August 2025
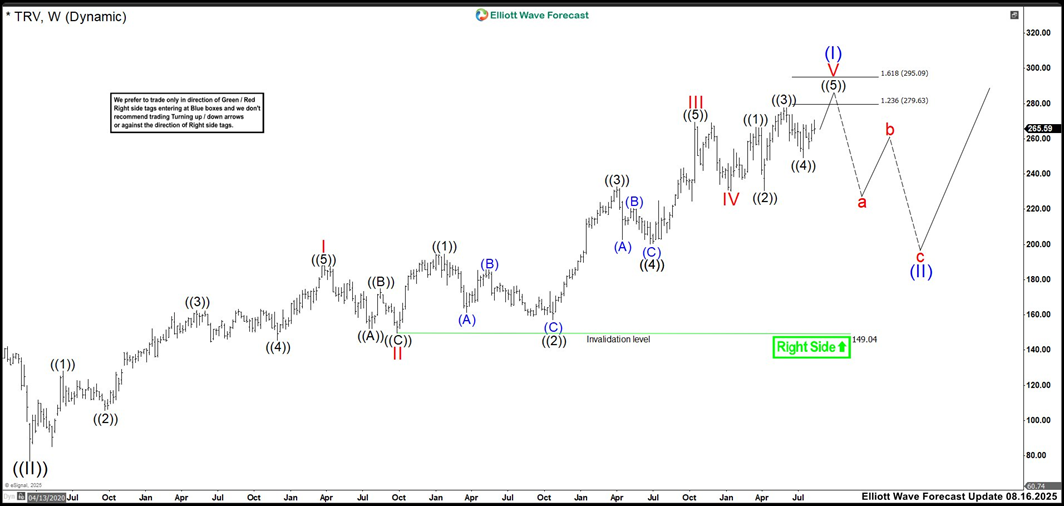
The chart for TRV illustrates a mature Elliott Wave impulse structure on the weekly timeframe, suggesting that the stock may be nearing the end of a bullish cycle. The labeling shows a possible ending diagonal structure ((1)) through ((5)), followed by a potential corrective abc pattern. The projected resistance zone lies between 279.63 and 295.09, based on Fibonacci tool, if there are not more extension higher, we should see a strong reaction lower from this area. The annotation emphasizes trading only in the direction of the green/red “Right Side” tags, reinforcing a disciplined, trend following strategy. Overall, the chart signals caution: while upside targets remain viable, a corrective pullback (waves a, b, c) may soon unfold, offering potential re-entry opportunities for traders aligned with the broader wave structure.
Author

Elliott Wave Forecast Team
ElliottWave-Forecast.com


