|

Elliott Wave perspective: Amazon (AMZN) approaches cycle peak post-August 2025 low

Amazon (AMZN) continues its cycle from the August 2025 low, unfolding as a five-wave impulse in the Elliott Wave framework. From that low, wave (i) peaked at $216.30, followed by a shallow pullback in wave (ii) to $213.25. The stock then surged in wave (iii) to $222.75, with a brief dip in wave (iv) concluding at $220.71. The final leg, wave (v), reached $226.22, completing wave ((i)) in a higher degree. A correction in wave ((ii)) followed, bottoming at $219.05.

Amazon (AMZN) – 60 Minute Elliott Wave technical chart

Chart

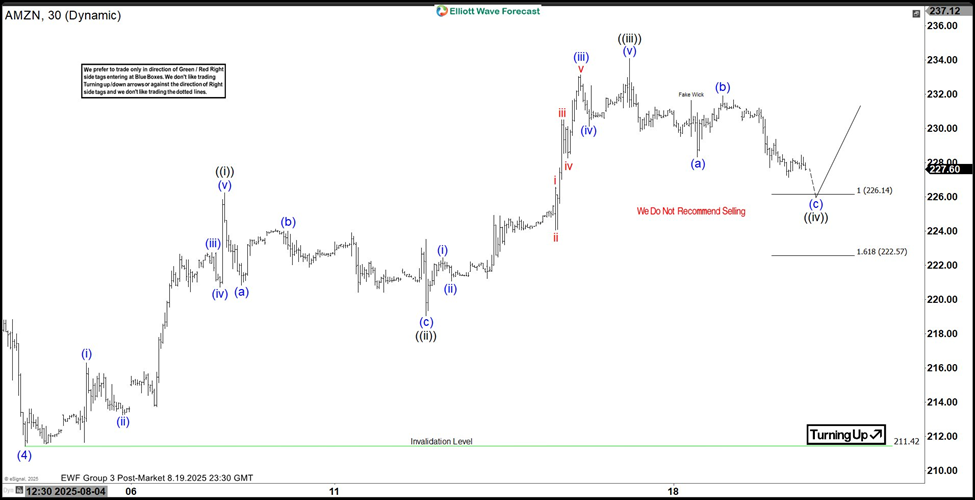
 After this pullback, the stock resumed its ascent in wave ((iii)). Wave (i) of this sequence hit $222.43, with wave (ii) retracing to $221.07. A strong advance in wave (iii) pushed the price to $233.11, followed by a dip in wave (iv) to $230.10. The final wave (v) concluded at $234.08, marking the end of wave ((iii)). Currently, wave ((iv)) is unfolding as a zigzag Elliott Wave structure. From the wave ((iii)) peak, wave (a) declined to $228.33, and wave (b) rallied to $231.91. Wave (c) of ((iv)) is expected to drive prices lower, targeting the extreme zone of $222.57–$226.14, based on the 100%–161.8% Fibonacci extension of wave (a). As long as the pivot low at $211.42 holds, the pullback should find support in a 3, 7, or 11 swing, setting the stage for further upside. This analysis highlights Amazon’s structured ascent and near-term corrective potential.

AMZN  – Elliott Wave technical video

Author

Elliott Wave Forecast Team

Elliott Wave Forecast Team

ElliottWave-Forecast.com

More from Elliott Wave Forecast Team
Share:

Markets move fast. We move first.

Orange Juice Newsletter brings you expert driven insights - not headlines. Every day on your inbox.

By subscribing you agree to our Terms and conditions.

Editor's Picks

EUR/USD flatlines below 1.1800 amid trading lull, awaits Fed Minutes

EUR/USD trades around a flatline below 1.1800 in European trading on Tuesday. The pair lacks any trading impetus as the US Dollar moves little amid market caution ahead of the Fed's December Meeting Minutes release, which could offer insights into the Federal Reserve’s 2026 outlook.

GBP/USD retakes 1.3500 despite the year-end grind

GBP/USD finds fresh demand and retakes 1.3500 on Tuesday as markets grind through the last trading week of the year. Despite the latest uptick, the pair is unlikely to see further progress due to the year-end holiday volumes.

Gold holds the bounce on Fed rate cut bets, safe-haven flows

Gold holds the rebound near $4,350 in the European trading hours on Tuesday. The precious metal recovers some lost ground after falling 4.5% in the previous session, which was Gold's largest single-day loss since October. Increased margin requirements on gold and silver futures by the Chicago Mercantile Exchange Group, one of the world’s largest trading floors for commodities, prompted widespread profit-taking and portfolio rebalancing.

Tron steadies as Justin Sun invests $18 million in Tron Inc.

Tron (TRX) trades above $0.2800 at press time on Monday, hovering below the 50-day Exponential Moving Average (EMA) at $0.2859.

Economic outlook 2026-2027 in advanced countries: Solidity test

After a year marked by global economic resilience and ending on a note of optimism, 2026 looks promising and could be a year of solid economic performance. In our baseline scenario, we expect most of the supportive factors at work in 2025 to continue to play a role in 2026.

Crypto market outlook for 2026

Year 2025 was volatile, as crypto often is.  Among positive catalysts were favourable regulatory changes in the U.S., rise of Digital Asset Treasuries (DAT), adoption of AI and tokenization of Real-World-Assets (RWA).