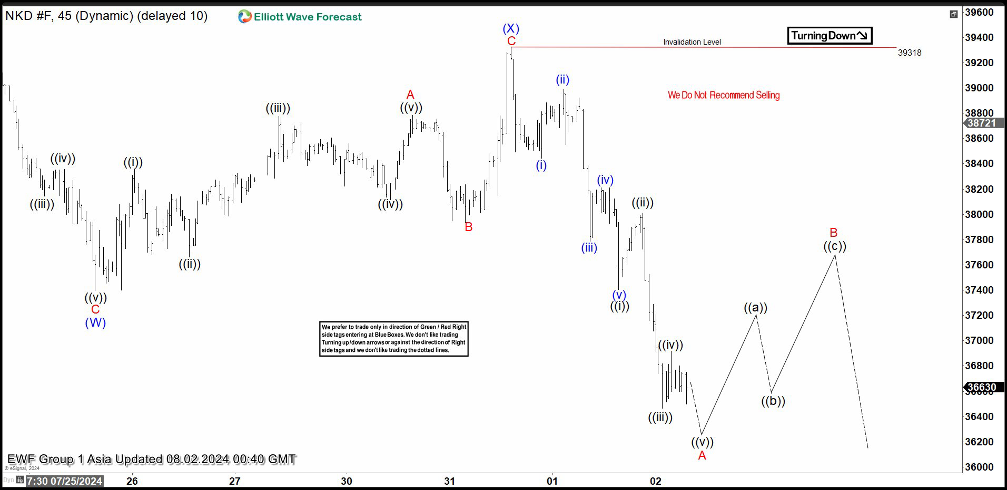
Short term Elliott Wave in Nikkei (NKD) suggests the Index shows short term incomplete bearish sequence from 7.10.2024 high favoring further downside. Decline from 7.10.2024 is in progress as a double three Elliott Wave structure. Down from 7.10.2024 high, wave (W) ended at 37395. Rally in wave (X) ended at 39318 with internal subdivision as a zigzag structure. Up from wave (W), wave A ended at 38785 and wave B ended at 37395. Wave C higher ended at 39318 which completed wave (X) in higher degree.
The index has turned lower in wave (Y) with internal subdivision as a zigzag structure. Down from wave (X), wave ((i)) ended at 37405 and wave ((ii)) ended at 38010. Wave ((iii)) lower ended at 36465 and wave ((iv)) ended at 36920. Final leg wave ((v)) ended at 36165 which completed wave A in higher degree. Wave B rally is in progress to correct cycle from 7.31.2024 high before it turns lower. Near term, while below 39318, expect rally to fail in 3, 7, or 11 swing for further downside. Potential target lower is 100% – 161.8% Fibonacci extension of wave (W). This area comes at 30932 – 34135 where buyers can appear for further upside or 3 waves rally at least.
Nikkei (NKD) 45 minutes Elliott Wave chart
NKD Elliott Wave [Video]
FURTHER DISCLOSURES AND DISCLAIMER CONCERNING RISK, RESPONSIBILITY AND LIABILITY Trading in the Foreign Exchange market is a challenging opportunity where above average returns are available for educated and experienced investors who are willing to take above average risk. However, before deciding to participate in Foreign Exchange (FX) trading, you should carefully consider your investment objectives, level of xperience and risk appetite. Do not invest or trade capital you cannot afford to lose. EME PROCESSING AND CONSULTING, LLC, THEIR REPRESENTATIVES, AND ANYONE WORKING FOR OR WITHIN WWW.ELLIOTTWAVE- FORECAST.COM is not responsible for any loss from any form of distributed advice, signal, analysis, or content. Again, we fully DISCLOSE to the Subscriber base that the Service as a whole, the individual Parties, Representatives, or owners shall not be liable to any and all Subscribers for any losses or damages as a result of any action taken by the Subscriber from any trade idea or signal posted on the website(s) distributed through any form of social-media, email, the website, and/or any other electronic, written, verbal, or future form of communication . All analysis, trading signals, trading recommendations, all charts, communicated interpretations of the wave counts, and all content from any media form produced by www.Elliottwave-forecast.com and/or the Representatives are solely the opinions and best efforts of the respective author(s). In general Forex instruments are highly leveraged, and traders can lose some or all of their initial margin funds. All content provided by www.Elliottwave-forecast.com is expressed in good faith and is intended to help Subscribers succeed in the marketplace, but it is never guaranteed. There is no “holy grail” to trading or forecasting the market and we are wrong sometimes like everyone else. Please understand and accept the risk involved when making any trading and/or investment decision. UNDERSTAND that all the content we provide is protected through copyright of EME PROCESSING AND CONSULTING, LLC. It is illegal to disseminate in any form of communication any part or all of our proprietary information without specific authorization. UNDERSTAND that you also agree to not allow persons that are not PAID SUBSCRIBERS to view any of the content not released publicly. IF YOU ARE FOUND TO BE IN VIOLATION OF THESE RESTRICTIONS you or your firm (as the Subscriber) will be charged fully with no discount for one year subscription to our Premium Plus Plan at $1,799.88 for EACH person or firm who received any of our content illegally through the respected intermediary’s (Subscriber in violation of terms) channel(s) of communication.
Recommended content
Editors’ Picks

EUR/USD struggles to retain 1.1500 as USD gains traction
EUR/USD hovers around the 1.1500 level in the American session on Friday. The US Dollar surges despite dovish comments from Fed Governor Waller, supporting a rate cut as soon as July. The mood sours as investors weigh Middle East developments.

GBP/USD dives below 1.3500 after weak UK data, resurgent USD
GBP/USD turned red for the day and approaches the 1.3450 area as the week comes to an end. Earlier in the day, the UK reported weak Retail Sales figures, although the ongoing slump seems related to renewed risk aversion fueling safe-haven US Dollar demand.

Gold surges above $3,3360 as fears kick in
Gold gathers near-term momentum and trades near $3,370 ahead of the weekly close, as risk sentiment took a turn to the south. Following a positive start, Wall Street turned south. Middle East tensions and massive back-and-forth missile exchanges between Iran and Israel seem to be behind the ongoing run to safety.

Ripple Price Prediction: How tokenized treasuries could accelerate XRP to $10 by end-2025
Ondo Finance launched tokenized treasuries on the XRP Ledger in June, paving the way for seamless institutional adoption. The market capitalization of tokenized treasuries has grown to $5.9 billion despite market uncertainty over US tariffs.

Weekly focus: War and risk of escalation weigh on market sentiment
The war between Israel and Iran and the risk of further escalation weighed on markets this week. Equity markets largely traded in red and US treasury yields slid lower. That said, markets were by no means in full risk-off sentiment.

The Best brokers to trade EUR/USD
SPONSORED Discover the top brokers for trading EUR/USD in 2025. Our list features brokers with competitive spreads, fast execution, and powerful platforms. Whether you're a beginner or an expert, find the right partner to navigate the dynamic Forex market.