Elliott Wave flat structure forecast leads to 277-pip EUR decline [Video]
![Elliott Wave flat structure forecast leads to 277-pip EUR decline [Video]](https://editorial.fxstreet.com/images/i/chameleon-chart-1.png)
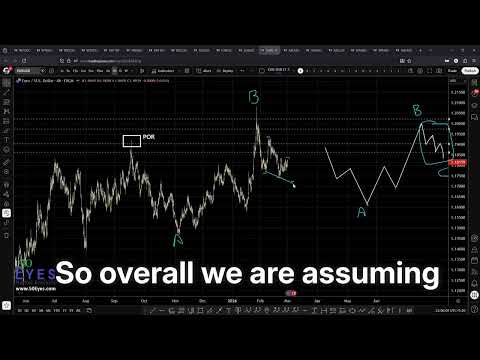
In this market outlook, the analysis was based on the development of an Elliott Wave flat correction, with expectations that the market was approaching the final stages of the corrective cycle. The primary focus was on the anticipated completion of the C-leg, which was projected to unfold in a structured and directional manner.
Market structure overview
The broader technical framework highlighted the following key elements:
- A flat correction pattern shaping the overall price structure.
- A clear A–B–C wave formation, indicating a corrective phase within the prevailing trend.
- The emergence of a diagonal structure inside Wave C, suggesting weakening upside momentum and increasing probability of downside continuation.
- A short trade opportunity identified during the progression of the C-wave.
This structural interpretation provided a roadmap for anticipating the next high-probability move in the market.
Trade outcome
As the structure matured, price action evolved in line with the projected wave path. The diagonal formation within Wave C facilitated a sustained bearish move, ultimately resulting in a decline of approximately 277 pips in EUR.
The accompanying video illustrates the original forecast, the structural reasoning behind the setup, and the subsequent market movement. A result snapshot at the end of the video highlights the actual downside move captured during this phase.
Key takeaway
This example reinforces how market structure analysis combined with Elliott Wave principles can help traders anticipate directional moves with favorable probability. By focusing on wave relationships, pattern completion zones, and internal price behavior, traders can develop structured trade plans rather than relying on reactive decision-making.
Such disciplined analysis continues to demonstrate the value of objective technical frameworks in navigating complex market environments.
Author

Neerav Yadav
50 Eyes Market Analysis
Neerav Yadav is a Futures trader who is in the markets since 2014 and trades primarily in Energy Futures, Gold, Indices, Stocks and other instruments.


