|

Elliott Wave analysis: META hits new high from blue box

Meta Platforms, formerly Facebook, is a tech company focused on building the “metaverse.” It owns Facebook, Instagram, and WhatsApp, and develops virtual reality (VR) and augmented reality (AR) products. $META is one of the 26 instruments we cover for members in Group 2.

After a significant decline of over 77% from its July 2021 record high, the stock has since delivered one of the best gains in the past two years. From the January 2023 lows, it has surged around 500% in a clear bullish sequence. When price is trending in a bullish sequence, we prefer buying dips in 3, 7, or 11 swings. Conversely, in a bearish sequence, we focus on selling bounces within the same 3, 7, or 11 swing corrective structure. This way, we align our trades with the dominant market direction.

Moreover, we mark potential trade zones with the Blue Box on our charts, which guides members on where to enter trades and place stop losses, ensuring they follow the market’s overall path effectively.

META Elliott Wave analysis 9.24.2024

Chart

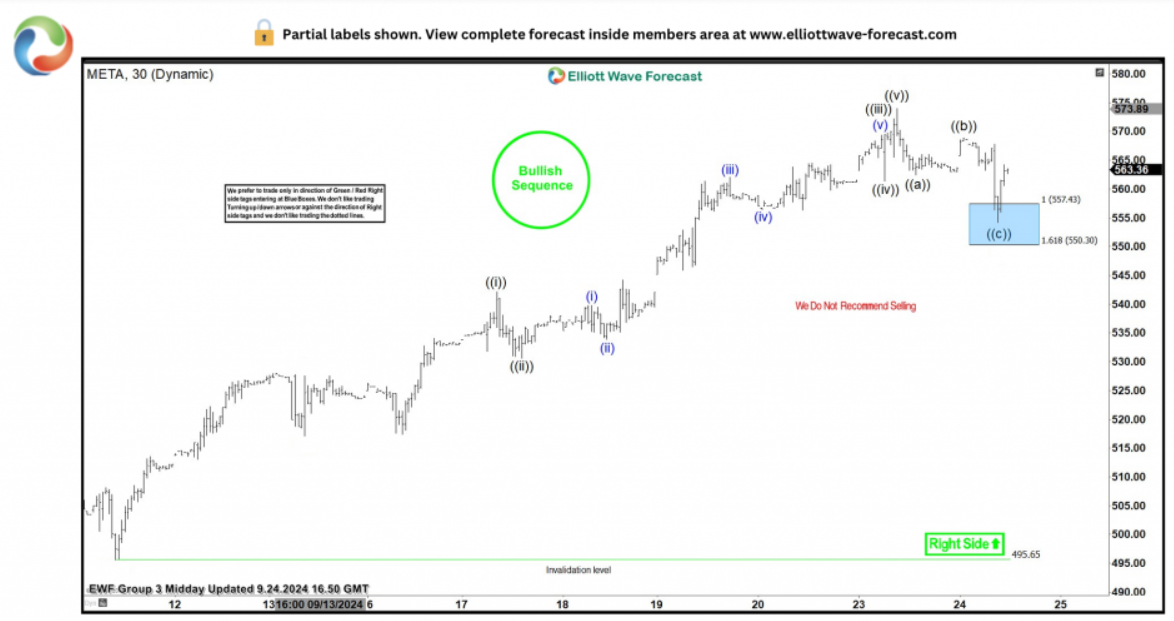
On 9.24.2024, we shared the META H1 chart with members. We identified a 3-swing pullback which we expected to complete within the 557.43-550.30 blue box range. We recommended traders consider buying from this blue box, placing stops below it. Additionally, we provided a trade management guide in the trading journal and live trading room.

As the chart above shows, traders went long from the blue box. Shortly afterward, the price reacted and separated from the blue box to a risk-free area.

META Elliott Wave analysis 10.02.2024

META

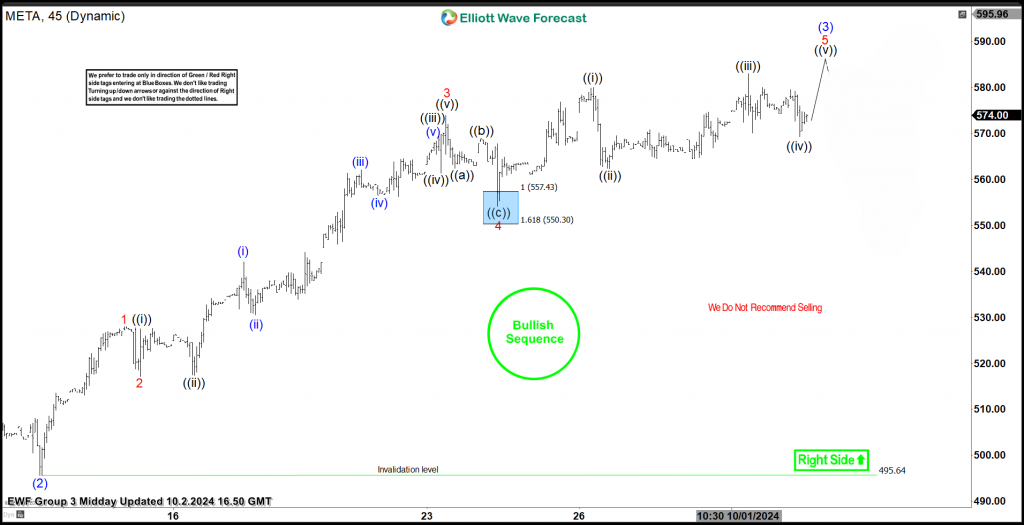
On 10.02.2024, we shared the chart above with members, highlighting how far the price has moved away from the blue box. The chart also indicates that the impulse wave sequence is likely incomplete. From wave ((iv)), the price is expected to rally in wave ((v)) to complete wave (3). Afterward, a pullback for wave (4) should occur, and we can consider buying again if the pullback meets our entry criteria.

Author

Elliott Wave Forecast Team

Elliott Wave Forecast Team

ElliottWave-Forecast.com

More from Elliott Wave Forecast Team
Share:

Markets move fast. We move first.

Orange Juice Newsletter brings you expert driven insights - not headlines. Every day on your inbox.

By subscribing you agree to our Terms and conditions.

Editor's Picks

EUR/USD drops to daily lows near 1.1630

EUR/USD now loses some traction and slips back to the area of daily lows around 1.1630 on the back of a mild bounce in the US Dollar. Fresh US data, including the September PCE inflation numbers and the latest read on December consumer sentiment, didn’t really move the needle, so the pair is still on course to finish the week with a respectable gain.

GBP/USD trims gains, recedes toward 1.3320

GBP/USD is struggling to keep its daily advance, coming under fresh pressure and retreating to the 1.3320 zone following a mild bullish attempt in the Greenback. Even though US consumer sentiment surprised to the upside, the US Dollar isn’t getting much love, as traders are far more interested in what the Fed will say next week.

Gold makes a U-turn, back to $4,200

Gold is now losing the grip and receding to the key $4,200 region per troy ounce following some signs of life in the Greenback and a marked bounce in US Treasury yields across the board. The positive outlook for the precious metal, however, remains underpinned by steady bets for extra easing by the Fed.

Crypto Today: Bitcoin, Ethereum, XRP pare gains despite increasing hopes of upcoming Fed rate cut

Bitcoin is steadying above $91,000 at the time of writing on Friday. Ethereum remains above $3,100, reflecting positive sentiment ahead of the Federal Reserve's (Fed) monetary policy meeting on December 10.

Week ahead – Rate cut or market shock? The Fed decides

Fed rate cut widely expected; dot plot and overall meeting rhetoric also matter. Risk appetite is supported by Fed rate cut expectations; cryptos show signs of life. RBA, BoC and SNB also meet; chances of surprises are relatively low.

Ripple faces persistent bear risks, shrugging off ETF inflows

Ripple is extending its decline for the second consecutive day, trading at $2.06 at the time of writing on Friday. Sentiment surrounding the cross-border remittance token continues to lag despite steady inflows into XRP spot ETFs.