EICHERMOT Elliott Wave technical analysis [Video]
![EICHERMOT Elliott Wave technical analysis [Video]](https://editorial.fxsstatic.com/images/i/nvidia-02_XtraLarge.jpg)
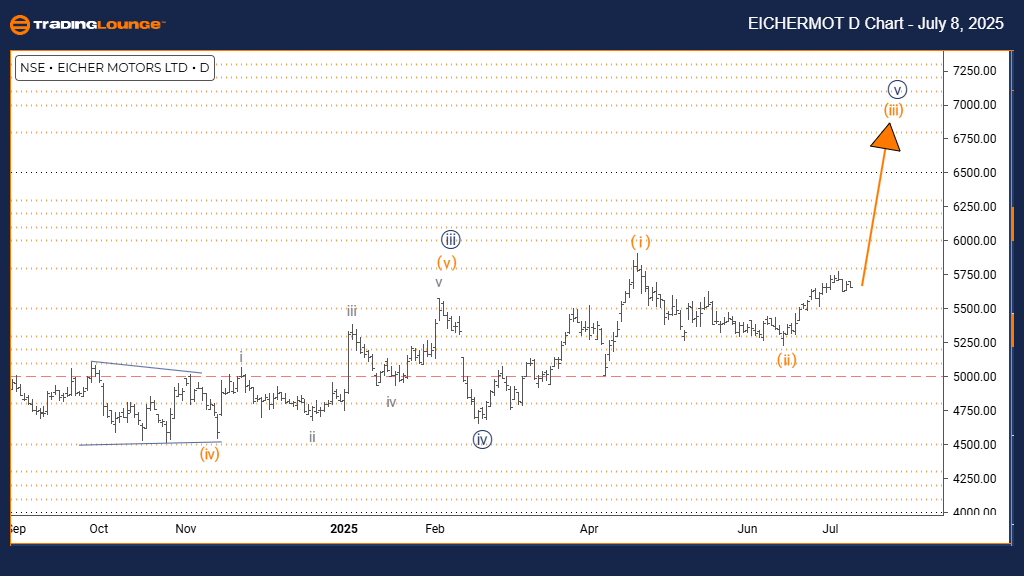
EICHER MOTORS Elliott Wave technical analysis
Function: Bullish Trend.
Mode: Impulsive.
Structure: Orange Wave 3.
Position: Navy Blue Wave 5.
Direction (Next Lower Degree): Orange Wave 4.
Details:
Orange wave 2 seems to be completed. The chart now shows either orange wave 3 or navy blue wave 5 in action.
Eicher Motors' daily chart reflects a bullish trend under Elliott Wave analysis. The current mode remains impulsive, signaling strong upward movement. The ongoing wave is identified as orange wave 3, forming part of the broader navy blue wave 5. This setup suggests the possibility of further gains in the near term.
Orange wave 2 looks completed, confirming that the stock has entered either orange wave 3 or navy blue wave 5. This signals ongoing upward momentum, consistent with a larger bullish pattern. The impulsive wave indicates active buying interest and continuation of the trend.
Traders and investors may take this as a bullish signal, expecting the price to rise further. Upon completion of orange wave 3, the market is likely to enter a corrective phase with orange wave 4. However, the broader trend represented by navy blue wave 5 remains strong, hinting at the potential for new highs.
The current analysis reinforces a bullish outlook for Eicher Motors. The main focus remains on how orange wave 3 develops, as it will define the next key price movements. Investors are advised to watch the wave progression closely to identify entry and exit points. As long as the impulsive structure stays intact, the positive trend is expected to continue. The next wave—orange wave 4—should provide a temporary pullback opportunity before the upward trend potentially resumes.
Summary:
Eicher Motors is currently in a bullish Elliott Wave phase with strong upward potential. The structure confirms ongoing positive momentum. However, traders should anticipate a future correction in orange wave 4. The impulsive pattern supports the outlook of continued buying pressure and a sustained uptrend.
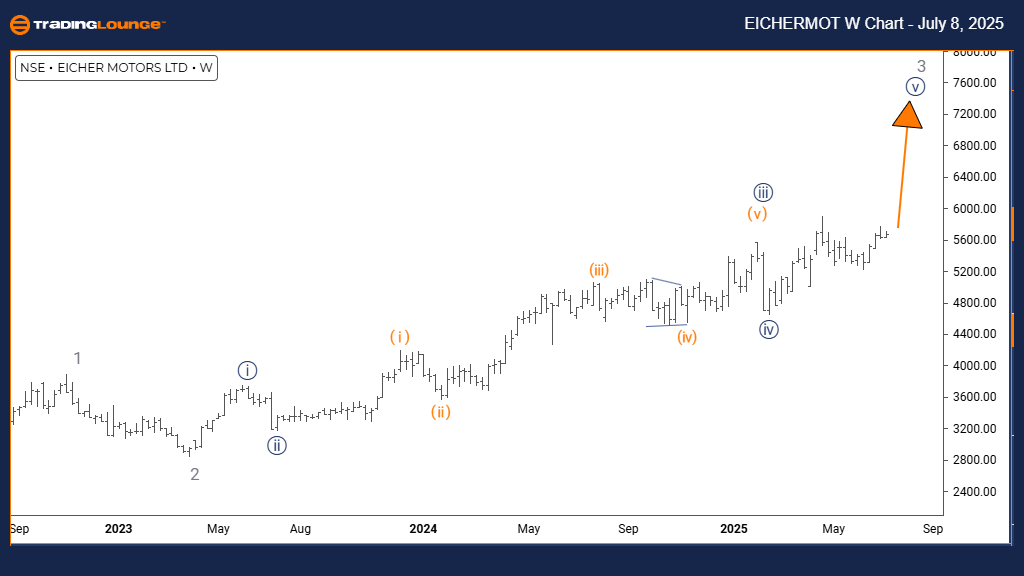
EICHER MOTORS Elliott Wave technical analysis
Function: Bullish Trend.
Mode: Impulsive.
Structure: Navy Blue Wave 5.
Position: Gray Wave 3.
Direction (Next lower degree): Gray Wave 4.
Details:
Navy blue wave 4 appears completed. The stock is now in navy blue wave 5 of gray wave 3.
On the weekly chart, Eicher Motors continues to exhibit a bullish trend based on Elliott Wave analysis. The impulsive mode confirms active buying pressure and upward price momentum. The wave structure shows navy blue wave 5 in progress, positioned within gray wave 3, signaling further upward potential.
The completion of navy blue wave 4 supports the transition into navy blue wave 5 of gray wave 3. This ongoing bullish phase reflects strong momentum, reinforcing the trend’s strength. The analysis suggests that as long as the impulsive structure remains valid, price gains are likely to continue.
Traders may view this as confirmation of continued bullish behavior, expecting higher prices before a possible correction. Once navy blue wave 5 concludes, the market is expected to correct in gray wave 4. This pullback may present a buying opportunity for those entering the trend.
The analysis emphasizes the movement of navy blue wave 5 within gray wave 3 as a driver for near-term price increases. Monitoring this progression is critical to identifying the optimal points for trading. The impulsive nature reflects a healthy trend supported by investor interest.
Summary:
Eicher Motors remains in a bullish Elliott Wave structure on the weekly chart. The completion of navy blue wave 4 enables the development of wave 5, indicating room for additional gains. A gray wave 4 correction is anticipated ahead, but the dominant trend remains upward. Continued monitoring of wave progression is advised for strategic entry points.
EICHER MOTORS Elliott Wave technical analysis [Video]
Author

Peter Mathers
TradingLounge
Peter Mathers started actively trading in 1982. He began his career at Hoei and Shoin, a Japanese futures trading company.


