Eicher Motors – EICHERMOT Elliott Wave technical analysis [Video]
![Eicher Motors – EICHERMOT Elliott Wave technical analysis [Video]](https://editorial.fxsstatic.com/images/i/car-industry-01_XtraLarge.jpg)
Eicher Motors Elliott Wave technical analysis – Day chart
Function: Bullish Trend.
Mode: Impulsive.
Structure: Orange Wave 3.
Position: Navy Blue Wave 5.
Direction next lower degrees: Orange Wave 4.
Details: Orange Wave 2 seems complete. Currently, either Orange Wave 3 or Navy Blue Wave 5 is unfolding.
The daily chart analysis of EICHER MOTORS shows a bullish market trend. The price is in an impulsive phase, signaling strong upward momentum. The current structure shows Orange Wave 3 is forming, which is part of a broader sequence — Navy Blue Wave 5. This setup suggests the stock is in a strong uptrend and nearing the end of a longer bullish cycle.
Orange Wave 2 appears to have ended its correction, transitioning the price into Orange Wave 3. This wave is usually the strongest in Elliott Wave theory, often leading to sharp price gains. After Orange Wave 3 finishes, a corrective move, Orange Wave 4, is expected as the next phase in the sequence.
The technical structure signals that EICHER MOTORS may continue its upward path. With Orange Wave 3 now active, strong buying interest is likely. However, traders should stay alert, as this third wave is within a fifth wave, indicating the cycle’s final bullish leg — Navy Blue Wave 5.

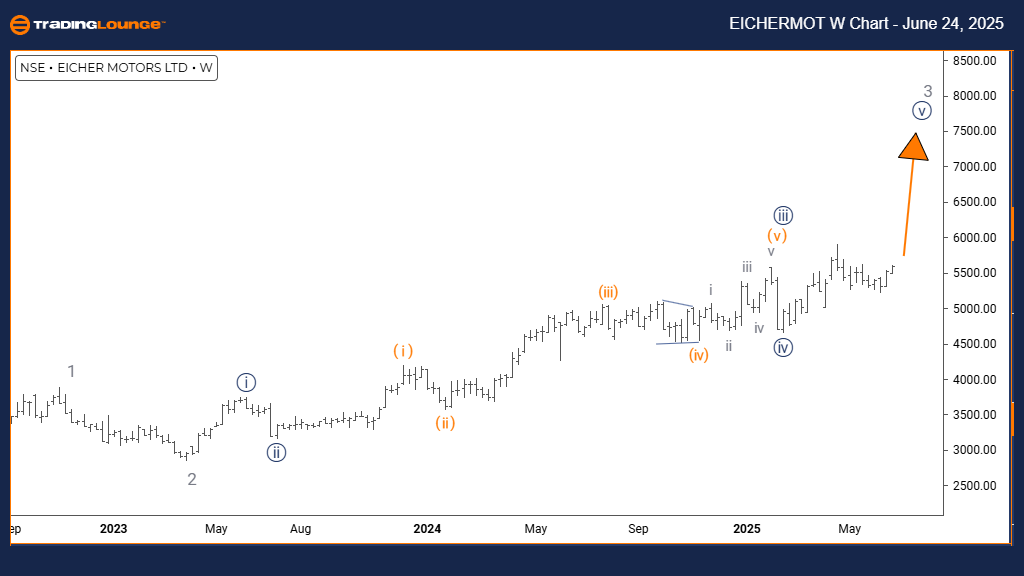
Eicher Motors Elliott Wave technical analysis – Weekly chart
Function: Bullish Trend.
Mode: Impulsive.
Structure: Navy Blue Wave 5.
Position: Gray Wave 3.
Direction next higher degrees: Navy Blue Wave 5 (Started).
Details: Navy Blue Wave 4 looks completed. Now, Navy Blue Wave 5 of 3 is currently in motion..
The weekly Elliott Wave chart for EICHER MOTORS confirms a bullish trend. Price action is in an impulsive phase, indicating strong upward momentum. The wave structure currently forming is Navy Blue Wave 5, which is part of the larger Gray Wave 3. This setup suggests the stock is in the final advancing segment of its ongoing bullish phase.
Navy Blue Wave 4 has likely ended its correction phase. Now, the price has transitioned into Navy Blue Wave 5, which often features powerful movements. This wave typically concludes the current Elliott Wave sequence, possibly preceding a larger correction or trend reversal. The next key wave to observe is Navy Blue Wave 5 as it continues to develop within Gray Wave 3.
The present technical pattern points toward further potential gains. With Navy Blue Wave 5 active, buying pressure appears strong. Yet, traders should exercise caution as this is the fifth wave, which may indicate the last phase of the current upward trend in Gray Wave 3.
Eicher Motors – EICHERMOT Elliott Wave technical analysis [Video]
Author

Peter Mathers
TradingLounge
Peter Mathers started actively trading in 1982. He began his career at Hoei and Shoin, a Japanese futures trading company.


