Dow outperformance keeps year-end rally hopes alive

US equities have pulled back over the past few sessions, but the relationship between the Dow Jones and the S&P 500 remains constructive, and that matters more than the headline red candles.
Over the last three trading days, both indices are lower, but the Dow has declined less than the S&P 500 (1.92% vs 2.03%). On its own, that difference looks marginal. Structurally, it is not.
Dow vs S&P 500: Structure tells the real story
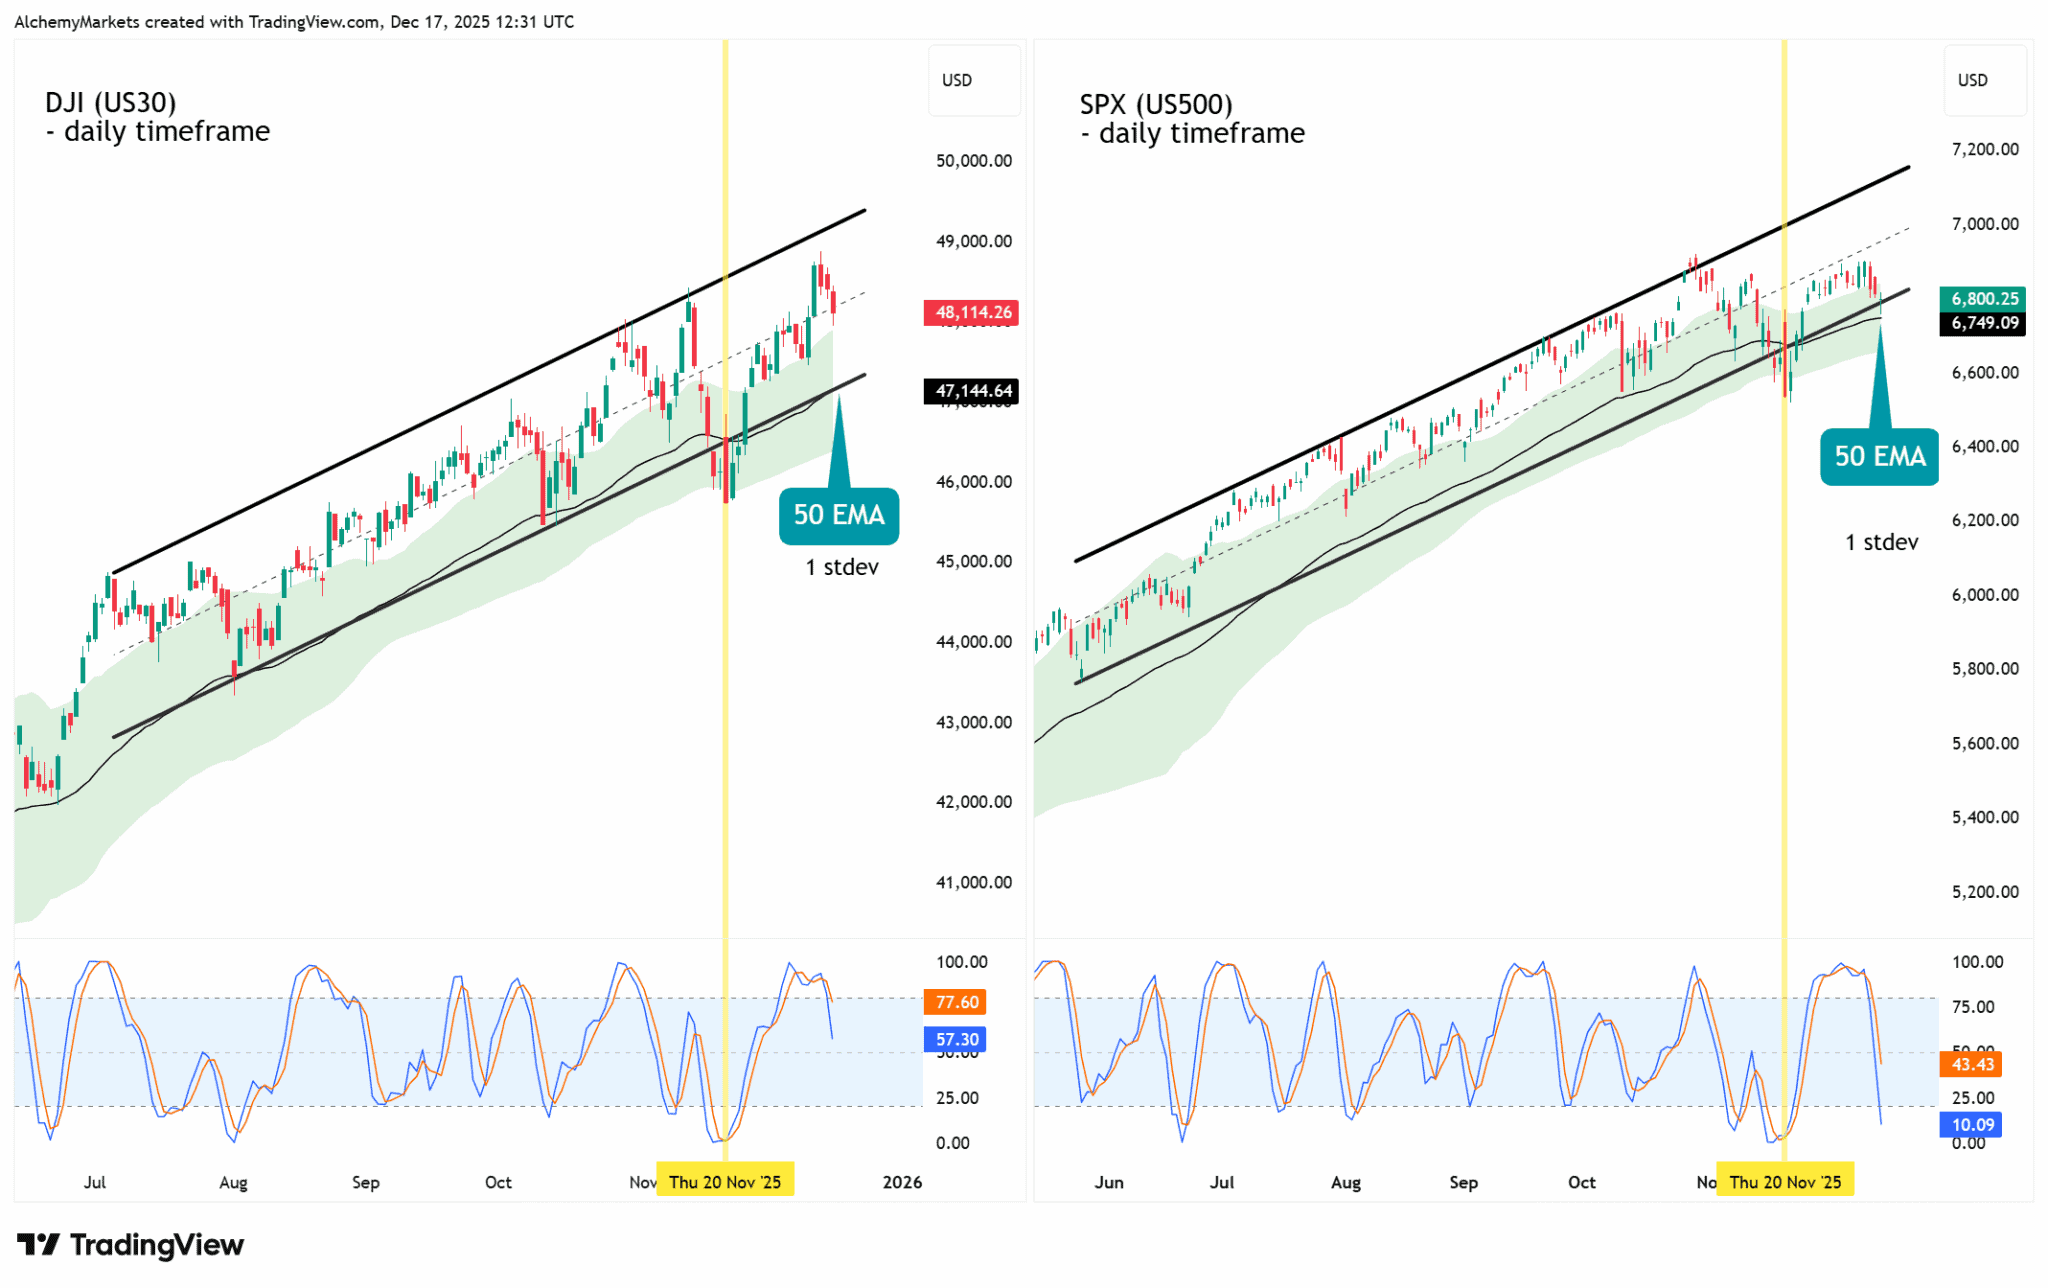
On the daily timeframe, the Dow Jones continues to respect its rising trend channel, holding above the 50-day EMA and staying comfortably within its one standard deviation band. Pullbacks remain orderly and corrective, not impulsive.
The S&P 500, meanwhile, has shown more volatility near the upper end of its channel, with sharper rejections and heavier reliance on EMA support. Momentum has cooled faster, even though the broader trend remains intact.
This divergence points to relative strength in more defensive, earnings-stable names, rather than broad risk aversion.
The November rally comparison adds weight
From early November to the December 12 peak:
- Dow Jones gained 6.91%.
- S&P 500 gained 5.85%.
That outperformance is consistent with what the charts are showing now. Capital has favoured industrials, value, and dividend-linked stocks over higher-beta growth. This is typical behaviour when investors remain constructive but selective.
What this says about the Santa rally
A year-end rally does not need aggressive upside momentum to remain valid. Historically, it often takes the form of:
- Shallow pullbacks.
- Trend support holding.
- Rotation into “safer” equity exposures.
The Dow leading while the S&P 500 consolidates fits that template. As long as Dow Jones structure remains intact, the broader equity market stays biased toward a grind higher into year-end, rather than a deeper correction.
Bottom line
This is not a risk-off signal. It is a sign of rotation and consolidation within an ongoing uptrend. Dow Jones leadership keeps the year-end rally narrative alive, even as the S&P 500 takes a breather.
For now, the tape suggests stability, not stress — and that is exactly what late-December equity rallies tend to be built on.
Author

Zorrays Junaid
Alchemy Markets
Zorrays Junaid has extensive combined experience in the financial markets as a portfolio manager and trading coach. More recently, he is an Analyst with Alchemy Markets, and has contributed to DailyFX and Elliott Wave Forecast in the past.


