Dow Jones Industrial Average rebounds as tariff exemptions begin to materialize
- The Dow Jones gained 470 points from Tuesday’s tumble.
- Equities remain tepid as investors hope for signs of easing trade war tensions.
- Services PMI figures beat the street, but ADP payrolls figures missed the mark.

The Dow Jones Industrial Average (DJIA) bounced from this week’s steep two-day plunge, recovering ground as investors try to prop the market back up. Equities took a hit after United States (US) President Donald Trump finally let his own tariffs on Canada, Mexico, and China take effect, but investors are hoping for another round of concessions and delays to ease trade war pressures.
USD ADP Employment Change payroll changes came in far below expectations, showing far fewer new jobs in February than median market forecasts. ADP showed just 77K net new job additions in February, well below March’s revised print of 186K, and flubbing the forecast of 140K. Despite the downside print, not all hope is lost for this week’s Nonfarm Payrolls (NFP) jobs report: the monthly ADP Employment Change has suffered a terrible run of non-correlation with NFP results ever since ADP changed their reporting and measurement methodology in 2022, so a bad or good print fails to signal much of anything at all.
The Trump administration is doing all of the hard work for everyone this week, with the White House declaring on Wednesday that it would grant a one-month delay on tariffs for the automotive industry. The US automotive manufacturing industry is heavily reliant on foreign trade, forcing Donald Trump's hand on retroactively declaring a brief exemption for his own country's auto industry as his team scrambles to figure out how to impose stiff tariffs on all of the US' closest trading partners without devasting their own economy.
Dow Jones news
Most of the Dow Jones’ listed securities are testing into the high side on Wednesday, looking to stage a recovery following this week’s tariff-inspired weakness. Chevron (CVX) fell 1.8% at its lowest, slipping below $150 per share after the Trump administration stripped away the energy conglomerate’s license to operate in Venezuela. Ostensibly, the Trump team feels Venezuelan President Nicolás Maduro has not done enough to reform the country’s electorate in the US’ image and is not generally willing to accept deported migrants who may or may not actually be Venezuelan.
Dow Jones price forecast
The Dow Jones managed to stop the bleeding this week, at least for now. Price action is battling it out to try and keep a foothold in the 43,000 level after catching a rough bounce from the 42,400 level.
The DJIA is dangerously close to making physical contact with the 200-day Exponential Moving Average (EMA) for the first time in over two years. However, the 200-day EMA is beginning to show signs of slowing, which could give bidders a chance to gather their feet beneath them and carry on the trend of outrunning the key moving average.
Dow Jones daily chart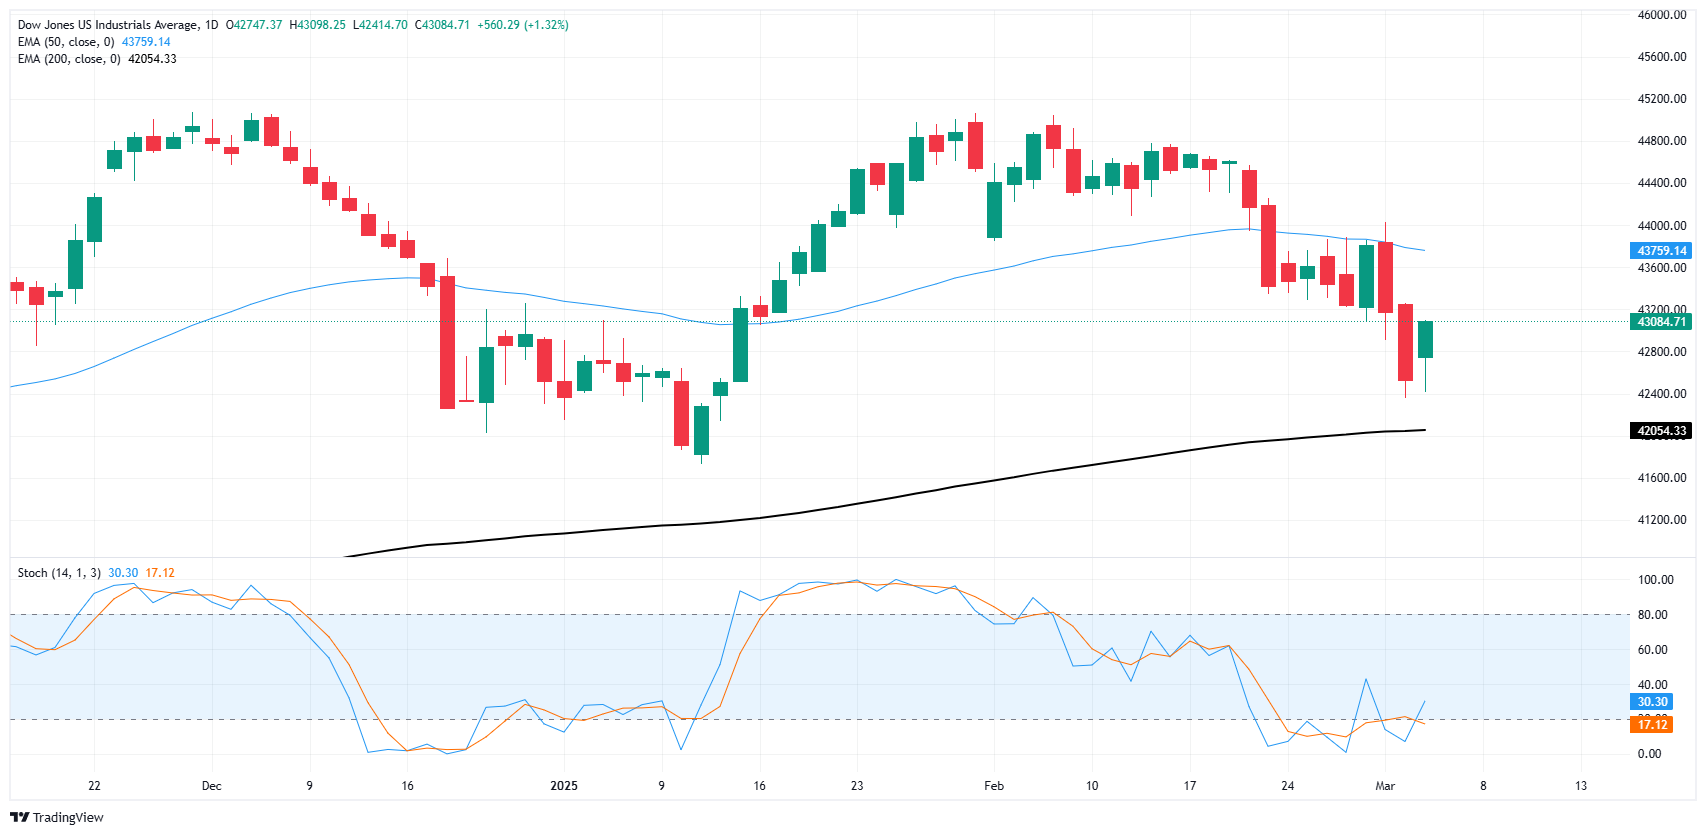
Dow Jones FAQs
The Dow Jones Industrial Average, one of the oldest stock market indices in the world, is compiled of the 30 most traded stocks in the US. The index is price-weighted rather than weighted by capitalization. It is calculated by summing the prices of the constituent stocks and dividing them by a factor, currently 0.152. The index was founded by Charles Dow, who also founded the Wall Street Journal. In later years it has been criticized for not being broadly representative enough because it only tracks 30 conglomerates, unlike broader indices such as the S&P 500.
Many different factors drive the Dow Jones Industrial Average (DJIA). The aggregate performance of the component companies revealed in quarterly company earnings reports is the main one. US and global macroeconomic data also contributes as it impacts on investor sentiment. The level of interest rates, set by the Federal Reserve (Fed), also influences the DJIA as it affects the cost of credit, on which many corporations are heavily reliant. Therefore, inflation can be a major driver as well as other metrics which impact the Fed decisions.
Dow Theory is a method for identifying the primary trend of the stock market developed by Charles Dow. A key step is to compare the direction of the Dow Jones Industrial Average (DJIA) and the Dow Jones Transportation Average (DJTA) and only follow trends where both are moving in the same direction. Volume is a confirmatory criteria. The theory uses elements of peak and trough analysis. Dow’s theory posits three trend phases: accumulation, when smart money starts buying or selling; public participation, when the wider public joins in; and distribution, when the smart money exits.
There are a number of ways to trade the DJIA. One is to use ETFs which allow investors to trade the DJIA as a single security, rather than having to buy shares in all 30 constituent companies. A leading example is the SPDR Dow Jones Industrial Average ETF (DIA). DJIA futures contracts enable traders to speculate on the future value of the index and Options provide the right, but not the obligation, to buy or sell the index at a predetermined price in the future. Mutual funds enable investors to buy a share of a diversified portfolio of DJIA stocks thus providing exposure to the overall index.
Author

Joshua Gibson
FXStreet
Joshua joins the FXStreet team as an Economics and Finance double major from Vancouver Island University with twelve years' experience as an independent trader focusing on technical analysis.


