Dow Jones Industrial Average eases lower as earnings doubts ripple through markets
- The Dow Jones saw its lowest figures in over a week on Thursday.
- Equities are extending a near-term backslide as investors reconsider sky-high valuations.
- Forecast-beating PMI prints helped to limit losses, but markets remain concerned about rate cut forecasts.

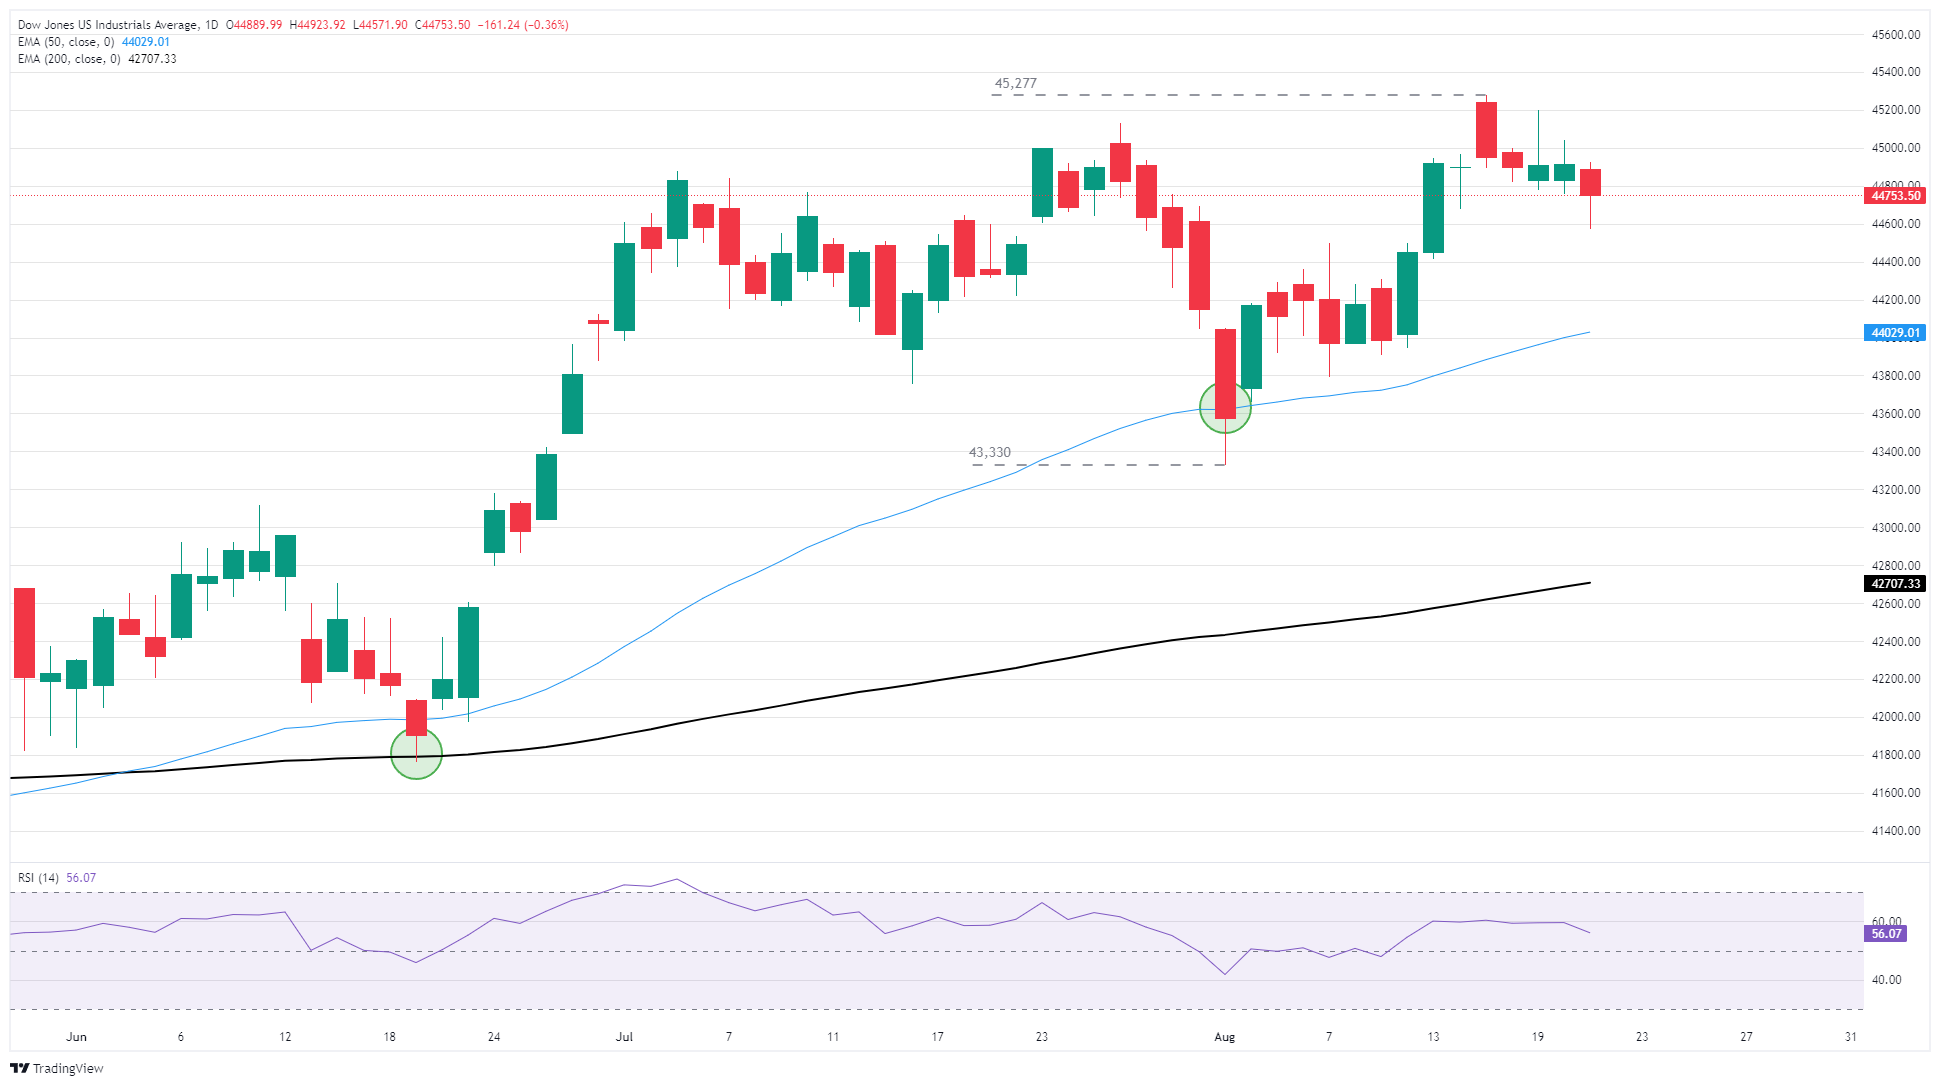
The Dow Jones Industrial Average (DJIA) softened on Thursday, testing 44,600 at its lowest point before staging a half-hearted recovery to 44,750. Equity traders are staring down the barrel of a hard adjustment to Federal Reserve (Fed) interest rate cut expectations in September, with tariff-led inflation effects poised to replace lagging employment figures as the top point of concern for policymakers.
The Dow Jones is still holding onto familiar chart territory, but a near-term backslide sees the major equity index battling to maintain a foothold just south of the 45,000 major price handle. The Dow is still trading well above the 50-day Exponential Moving Average (EMA) near 44,000, but bullish momentum is facing an increasingly steep climb to recover record highs above 45,277.
Policywatchers looking for signs of rate cuts
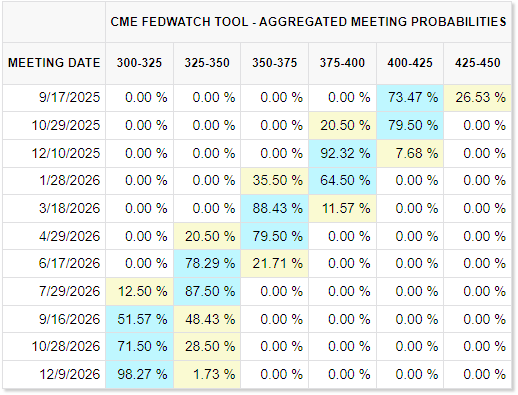
The annual Jackson Hole economic symposium, hosted by the Fed Bank of Kansas City, kicked off on Thursday. Investors should expect a steady stream of highlights and policy jargon over the coming days, but the key event will be Fed Chair Jerome Powell’s appearance at the central banker shindig on Friday morning. Markets continue to pine for an interest rate trim on September 17, but a recent pivot by Fed officials back into focusing on the threat of inflation has spooked some investors. According to the CME’s FedWatch Tool, market bets of an interest rate cut in September are still holding on the high end at a little under 75%, but this still marks a sharp step down from last week’s 90%.
US data watch: PMI surveys point to tariff impacts landing in the pockets of consumers
S&P Global Purchasing Managers Index (PMI) data for August came in above expectations, but still gave a mixed picture on overall business sentiment. Shifting global supply chains pushed the Manufacturing PMI to a 39-month high of 53.3, with the Manufacturing Output Index rising to 55.2, also a 39-month high. Businesses remain concerned about tariff impacts looming ever closer, but fresh inventory build-outs to replace the early year’s pre-tariff push have put more pricing power in the hands of businesses, allowing them to pass tariff pricing effects onto consumers. Inventory stockpiling itself is being driven by rising concerns about future supply chain disruptions, making it even more likely, not less, that tariffs will be passed directly onto US consumers.
WalMart tumbles after failing to grow as fast as expected
Walmart (WMT) single-handedly dragged the Dow Jones lower on Thursday, falling around 5% on the day despite raising its full-year earnings and sales outlook. Despite a strong quarterly performance and topping overall sales estimates, the company fell short on earnings, missing its quarterly forecast for the first time in over three years. Walmart now expects its net sales to grow up to 4.75% through the entire fiscal year, bolstered by strong growth in its online sales platform. However, the retail megagiant also acknowledged that its online sales and physical store sales are on the rise as US consumers begin to bargain hunt in earnest, driven to deal-hunting and discount shopping by rising tariff impacts, and Walmart cautioned that tariff effects are pushing prices higher across key segments.
Walmart Chief Financial Officer John David noted that although the company has successfully absorbed some tariff costs in its global supply chain, some price impacts have already been passed onto consumers, and further pass-through of tariff prices should be expected as tariff costs continue to drift upward. It remains unclear when US President Donald Trump’s claims that foreign exporters would shoulder the cost of tariffs will begin to take effect.
Dow Jones daily chart
Dow Jones FAQs
The Dow Jones Industrial Average, one of the oldest stock market indices in the world, is compiled of the 30 most traded stocks in the US. The index is price-weighted rather than weighted by capitalization. It is calculated by summing the prices of the constituent stocks and dividing them by a factor, currently 0.152. The index was founded by Charles Dow, who also founded the Wall Street Journal. In later years it has been criticized for not being broadly representative enough because it only tracks 30 conglomerates, unlike broader indices such as the S&P 500.
Many different factors drive the Dow Jones Industrial Average (DJIA). The aggregate performance of the component companies revealed in quarterly company earnings reports is the main one. US and global macroeconomic data also contributes as it impacts on investor sentiment. The level of interest rates, set by the Federal Reserve (Fed), also influences the DJIA as it affects the cost of credit, on which many corporations are heavily reliant. Therefore, inflation can be a major driver as well as other metrics which impact the Fed decisions.
Dow Theory is a method for identifying the primary trend of the stock market developed by Charles Dow. A key step is to compare the direction of the Dow Jones Industrial Average (DJIA) and the Dow Jones Transportation Average (DJTA) and only follow trends where both are moving in the same direction. Volume is a confirmatory criteria. The theory uses elements of peak and trough analysis. Dow’s theory posits three trend phases: accumulation, when smart money starts buying or selling; public participation, when the wider public joins in; and distribution, when the smart money exits.
There are a number of ways to trade the DJIA. One is to use ETFs which allow investors to trade the DJIA as a single security, rather than having to buy shares in all 30 constituent companies. A leading example is the SPDR Dow Jones Industrial Average ETF (DIA). DJIA futures contracts enable traders to speculate on the future value of the index and Options provide the right, but not the obligation, to buy or sell the index at a predetermined price in the future. Mutual funds enable investors to buy a share of a diversified portfolio of DJIA stocks thus providing exposure to the overall index.
Author

Joshua Gibson
FXStreet
Joshua joins the FXStreet team as an Economics and Finance double major from Vancouver Island University with twelve years' experience as an independent trader focusing on technical analysis.