Dow Jones Industrial Average struggles to find gains in post-NFP risk appetite surge
- Dow Jones churned but went nowhere after US NFP beats forecasts.
- Despite NFP beat, steep revisions sparked rate cut hopes.
- Rebounding risk sentiment pushed other indexes higher but left Dow Jones behind.

The Dow Jones Industrial Average (DJIA) whipsawed on Friday, churning around 39,300.00 after US Nonfarm Payrolls (NFP) gave markets just enough wiggle room to reignite rate cut hopes. The broader US equity market firmly climbed on fresh expectations of a rate trim from the Federal Reserve (Fed), but the Dow Jones remained mired in technical consolidation.
Read more: US Nonfarm Payrolls increase 206,000 in June vs. 190,000 forecast
Friday’s US NFP beat median market forecasts, adding 206K net new jobs in June. While the figure handily beat the expected 190K, the previous month saw a sharp downside revision to 218K from the initial print of 272K.
US Average Hourly Earnings growth also cooled for the year ended June, easing to the expected 3.9% YoY compared to the previous period’s 4.1%. The US Unemployment Rate also ticked higher, rising to 4.1% for the first time since December of 2021. Markets had broadly forecast a hold at 4.0%.
Fed Semi-Annual Policy Report: Need greater confidence before moving to rate cuts
Investors have brushed off the above-forecast NFP print to focus on rising unemployment, cooling wages, and downside revisions to previous jobs reports to scale up bets that the Fed will get pushed towards rate cuts sooner rather than later. According to the CME’s FedWatch Tool, rate markets are pricing in nearly 80% odds of at least a quarter-point rate trim on September 18.
Economic Indicator
Nonfarm Payrolls
The Nonfarm Payrolls release presents the number of new jobs created in the US during the previous month in all non-agricultural businesses; it is released by the US Bureau of Labor Statistics (BLS). The monthly changes in payrolls can be extremely volatile. The number is also subject to strong reviews, which can also trigger volatility in the Forex board. Generally speaking, a high reading is seen as bullish for the US Dollar (USD), while a low reading is seen as bearish, although previous months' reviews and the Unemployment Rate are as relevant as the headline figure. The market's reaction, therefore, depends on how the market assesses all the data contained in the BLS report as a whole.
Read more.Last release: Fri Jul 05, 2024 12:30
Frequency: Monthly
Actual: 206K
Consensus: 190K
Previous: 272K
Source: US Bureau of Labor Statistics
America’s monthly jobs report is considered the most important economic indicator for forex traders. Released on the first Friday following the reported month, the change in the number of positions is closely correlated with the overall performance of the economy and is monitored by policymakers. Full employment is one of the Federal Reserve’s mandates and it considers developments in the labor market when setting its policies, thus impacting currencies. Despite several leading indicators shaping estimates, Nonfarm Payrolls tend to surprise markets and trigger substantial volatility. Actual figures beating the consensus tend to be USD bullish.
Dow Jones news
Despite struggling to match Friday gains posted by other major equity indexes, Dow Jones is tilted notably into the high side. Two-thirds of the DJIA’s constituent equities are in the green, with losses being led by Chevron Corp. (CVX) which fell -1.65% to $154.13 per share. Dow Inc. (DOW) trails close behind, backsliding -1.43% to $52.12 per share.
Walmart Inc. (WMT) has surged to the top of the index, climbing 2.4% on the day and challenging $70.00 per share, followed by Intel Corp. (INTC) which gained 2.2% on Friday, pushing into $32.00 per share.
Dow Jones technical outlook
The Dow Jones closes out the first trading week of July struggling to keep above 33,300.00 after a protracted week of chart churn. The index bottomed out late last week near 38,920.00, but a recovery has faced significant downside pressure, this repeated failures to break free of the week’s peak bids near 39,440.00.
The Dow Jones remains hobbled by as supply zone priced in above 39,750.00, and bidders remain unable to shoulder the equity index back above all-time peaks set above 40,000.00 in May.
Dow Jones hourly chart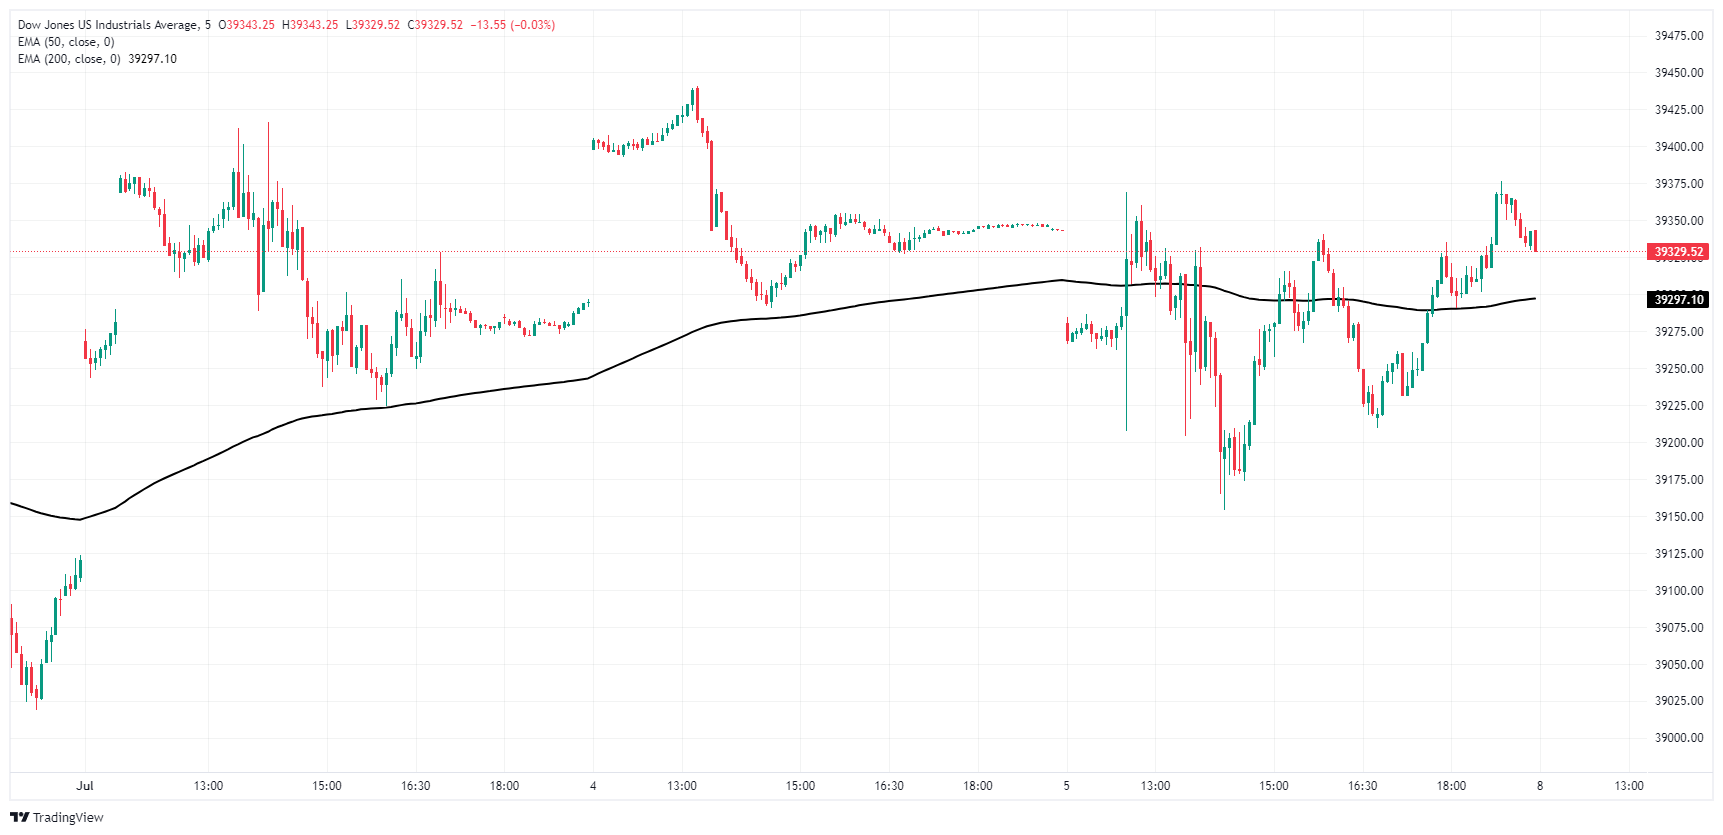
Dow Jones daily chart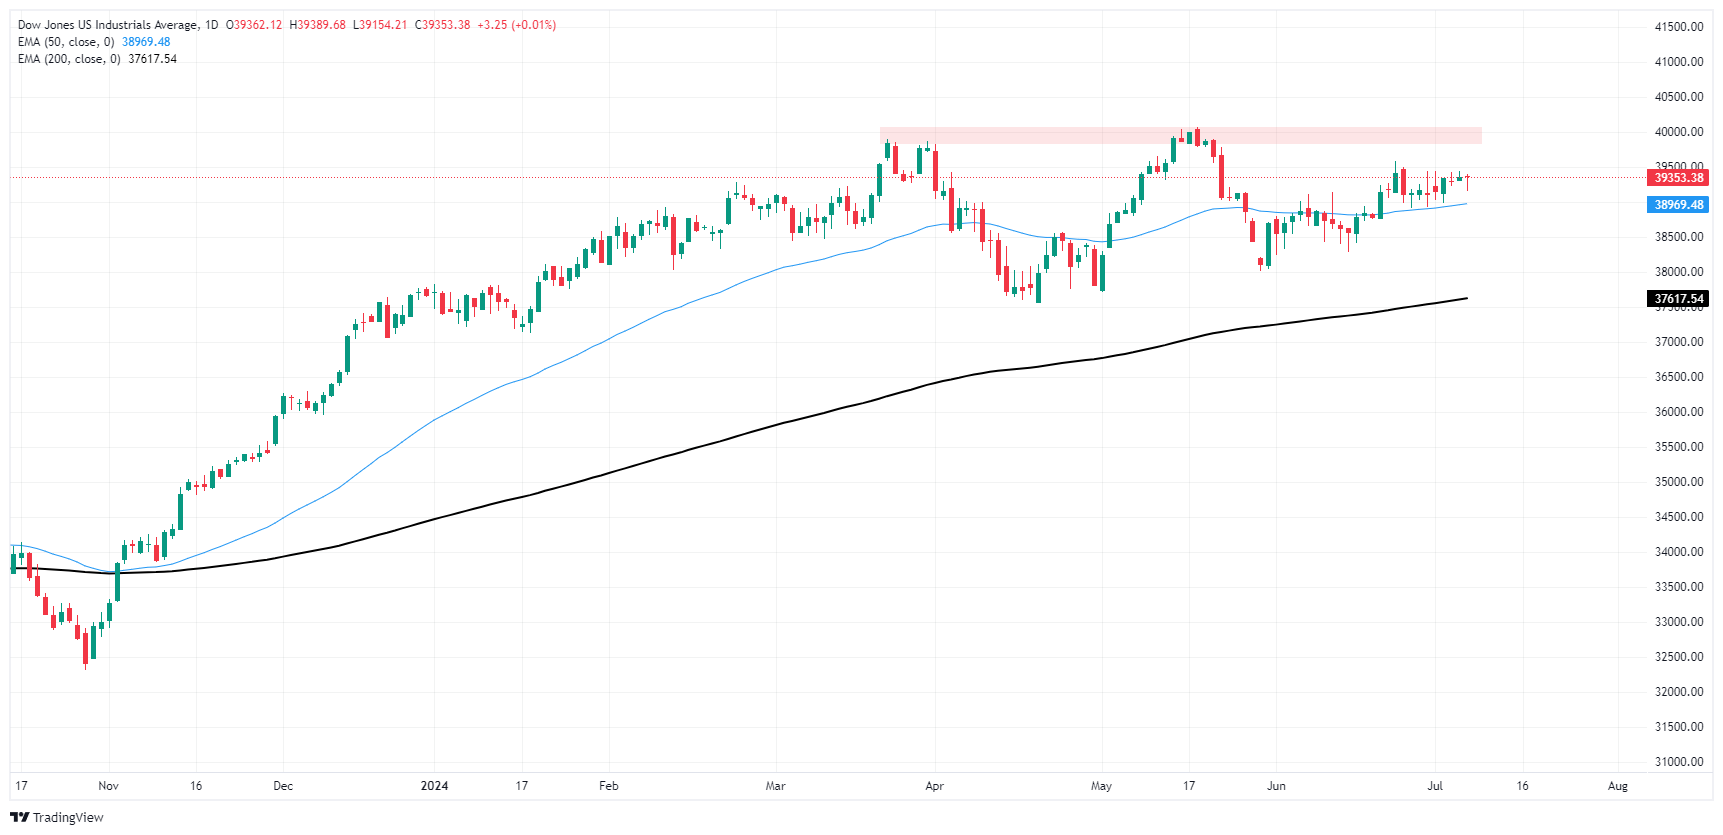
Dow Jones FAQs
The Dow Jones Industrial Average, one of the oldest stock market indices in the world, is compiled of the 30 most traded stocks in the US. The index is price-weighted rather than weighted by capitalization. It is calculated by summing the prices of the constituent stocks and dividing them by a factor, currently 0.152. The index was founded by Charles Dow, who also founded the Wall Street Journal. In later years it has been criticized for not being broadly representative enough because it only tracks 30 conglomerates, unlike broader indices such as the S&P 500.
Many different factors drive the Dow Jones Industrial Average (DJIA). The aggregate performance of the component companies revealed in quarterly company earnings reports is the main one. US and global macroeconomic data also contributes as it impacts on investor sentiment. The level of interest rates, set by the Federal Reserve (Fed), also influences the DJIA as it affects the cost of credit, on which many corporations are heavily reliant. Therefore, inflation can be a major driver as well as other metrics which impact the Fed decisions.
Dow Theory is a method for identifying the primary trend of the stock market developed by Charles Dow. A key step is to compare the direction of the Dow Jones Industrial Average (DJIA) and the Dow Jones Transportation Average (DJTA) and only follow trends where both are moving in the same direction. Volume is a confirmatory criteria. The theory uses elements of peak and trough analysis. Dow’s theory posits three trend phases: accumulation, when smart money starts buying or selling; public participation, when the wider public joins in; and distribution, when the smart money exits.
There are a number of ways to trade the DJIA. One is to use ETFs which allow investors to trade the DJIA as a single security, rather than having to buy shares in all 30 constituent companies. A leading example is the SPDR Dow Jones Industrial Average ETF (DIA). DJIA futures contracts enable traders to speculate on the future value of the index and Options provide the right, but not the obligation, to buy or sell the index at a predetermined price in the future. Mutual funds enable investors to buy a share of a diversified portfolio of DJIA stocks thus providing exposure to the overall index.
Author

Joshua Gibson
FXStreet
Joshua joins the FXStreet team as an Economics and Finance double major from Vancouver Island University with twelve years' experience as an independent trader focusing on technical analysis.


