Dow Jones Industrial Average bounces back as investors bank on Middle East peace
- The Dow Jones climbed around 350 points on Monday, challenging the 42,500 region.
- Investors are betting on some sort of resolution in the Israel-Iran conflict that cropped up last week.
- Despite a positive tilt to equities, trade concerns and Middle East conflicts are keeping bullish momentum capped.

The Dow Jones Industrial Average (DJIA) found firmer footing on Monday, kicking off the new trading week on a high note and paring away most of the late-week losses that pushed indexes into the red last Friday. Israel launched strikes against Iranian targets under the auspices of denying Iran access to nuclear weapons. Israel is one of only four countries to not sign the Nuclear Non-Proliferation Treaty, and is also not a party to the Treaty on the Prohibition of Nuclear Weapons.
Despite Israel’s strikes quickly spiraling out into barrages of missile launches between Iran and Israel that continued through the weekend and into Monday, investors are still banking on a potential ceasefire, or at least a cooling of constantly rising Middle East tensions. Equities rallied on Monday following headlines from the Wall Street Journal that Iran was “open” to the idea of engaging in peace talks with Israel. However, the Iranian government, through the Qatari state-controlled media outlet Al Jazeera, denied the reports as false. Undeterred, traders are hedging their bets that a resolution will be found, rather than continuing to boil over into a widespread conflict.
Aggregated consumer sentiment figures rose for the first time in almost seven months last week, adding further pressure on the long side. Rebounding consumer sentiment comes at a time when Federal Reserve (Fed) policymakers are still locked in “wait and see” mode on possible economic fallout from the Trump administration’s whiplash trade “policies”, which primarily consist of threatening and then canceling widespread import taxes.
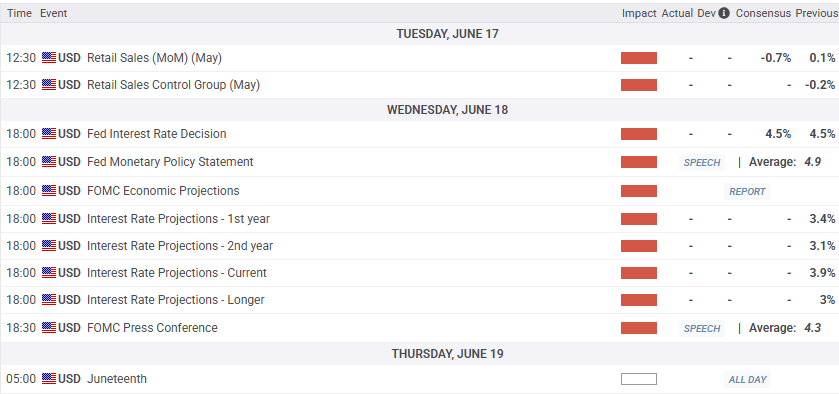
Fed on deck, another rate hold expected
The Fed is poised to make another interest rate call this week; the central bank is broadly expected to stand pat on interest rates once again, a move that will likely draw further ire from President Donald Trump. Trump has expressed frustration at multiple stages at the Fed’s unwillingness to ease interest rates as he scrambles to find a way to make federal debt more manageable; Trump’s bespoke “Big Beautiful Budget Bill” is expected to add trillions to the federal deficit over the next decade, despite campaigning on a platform of eliminating the federal debt overhang “within months” of taking office.
According to the CME’s FedWatch Tool, interest rate traders are currently pricing in 70% odds of at least a quarter-point rate cut in September. A follow-up rate trim is expected in either October or December, with odds flipping between the two on a day-by-day basis.
Read more stock news: IBM stock leads Dow Jones higher
Dow Jones price forecast
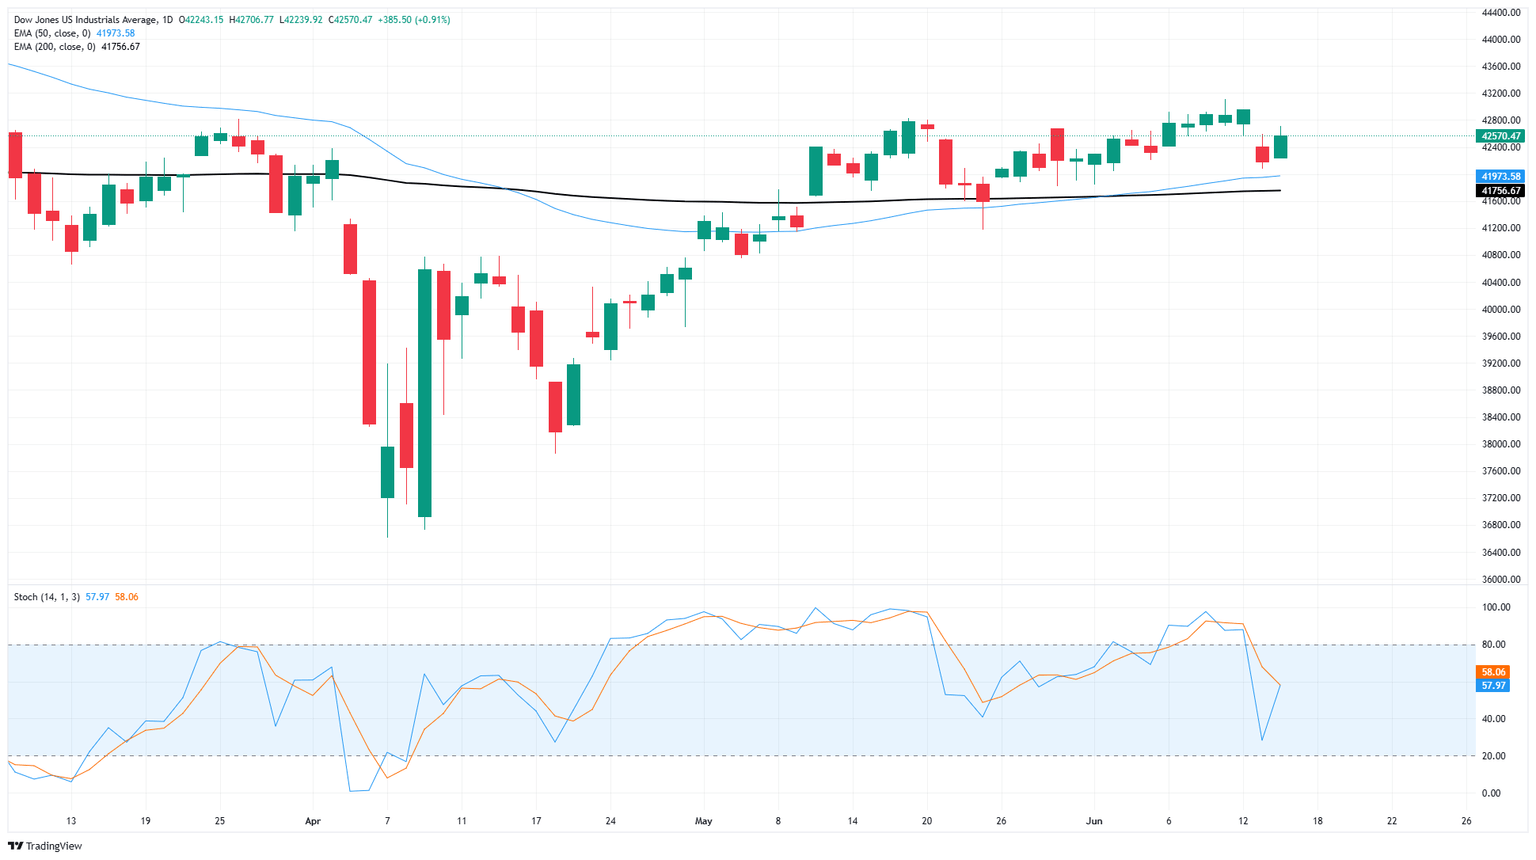
Monday’s bullish push has pared back some of last week’s late losses, pushing the Dow Jones Industrial Average back above 42,500. However, the major equity index remains embroiled in a consolidation zone that has plagued the Dow since mid-May.
The Dow Jones found fresh highs north of the 43,000 major price handle last week before Middle East headlines knocked investor sentiment lower, taking DJIA bids with it. The Dow still has a major technical floor priced in from the 200-day Exponential Moving Average (EMA) near 41,800, and the 50-day EMA is in the process of confirming a bullish cross of the long-run moving average.
Dow Jones daily chart
Dow Jones FAQs
The Dow Jones Industrial Average, one of the oldest stock market indices in the world, is compiled of the 30 most traded stocks in the US. The index is price-weighted rather than weighted by capitalization. It is calculated by summing the prices of the constituent stocks and dividing them by a factor, currently 0.152. The index was founded by Charles Dow, who also founded the Wall Street Journal. In later years it has been criticized for not being broadly representative enough because it only tracks 30 conglomerates, unlike broader indices such as the S&P 500.
Many different factors drive the Dow Jones Industrial Average (DJIA). The aggregate performance of the component companies revealed in quarterly company earnings reports is the main one. US and global macroeconomic data also contributes as it impacts on investor sentiment. The level of interest rates, set by the Federal Reserve (Fed), also influences the DJIA as it affects the cost of credit, on which many corporations are heavily reliant. Therefore, inflation can be a major driver as well as other metrics which impact the Fed decisions.
Dow Theory is a method for identifying the primary trend of the stock market developed by Charles Dow. A key step is to compare the direction of the Dow Jones Industrial Average (DJIA) and the Dow Jones Transportation Average (DJTA) and only follow trends where both are moving in the same direction. Volume is a confirmatory criteria. The theory uses elements of peak and trough analysis. Dow’s theory posits three trend phases: accumulation, when smart money starts buying or selling; public participation, when the wider public joins in; and distribution, when the smart money exits.
There are a number of ways to trade the DJIA. One is to use ETFs which allow investors to trade the DJIA as a single security, rather than having to buy shares in all 30 constituent companies. A leading example is the SPDR Dow Jones Industrial Average ETF (DIA). DJIA futures contracts enable traders to speculate on the future value of the index and Options provide the right, but not the obligation, to buy or sell the index at a predetermined price in the future. Mutual funds enable investors to buy a share of a diversified portfolio of DJIA stocks thus providing exposure to the overall index.
Author

Joshua Gibson
FXStreet
Joshua joins the FXStreet team as an Economics and Finance double major from Vancouver Island University with twelve years' experience as an independent trader focusing on technical analysis.


