Dow Jones Industrial Average rebounds after PCE inflation print keeps rate cut hopes alive
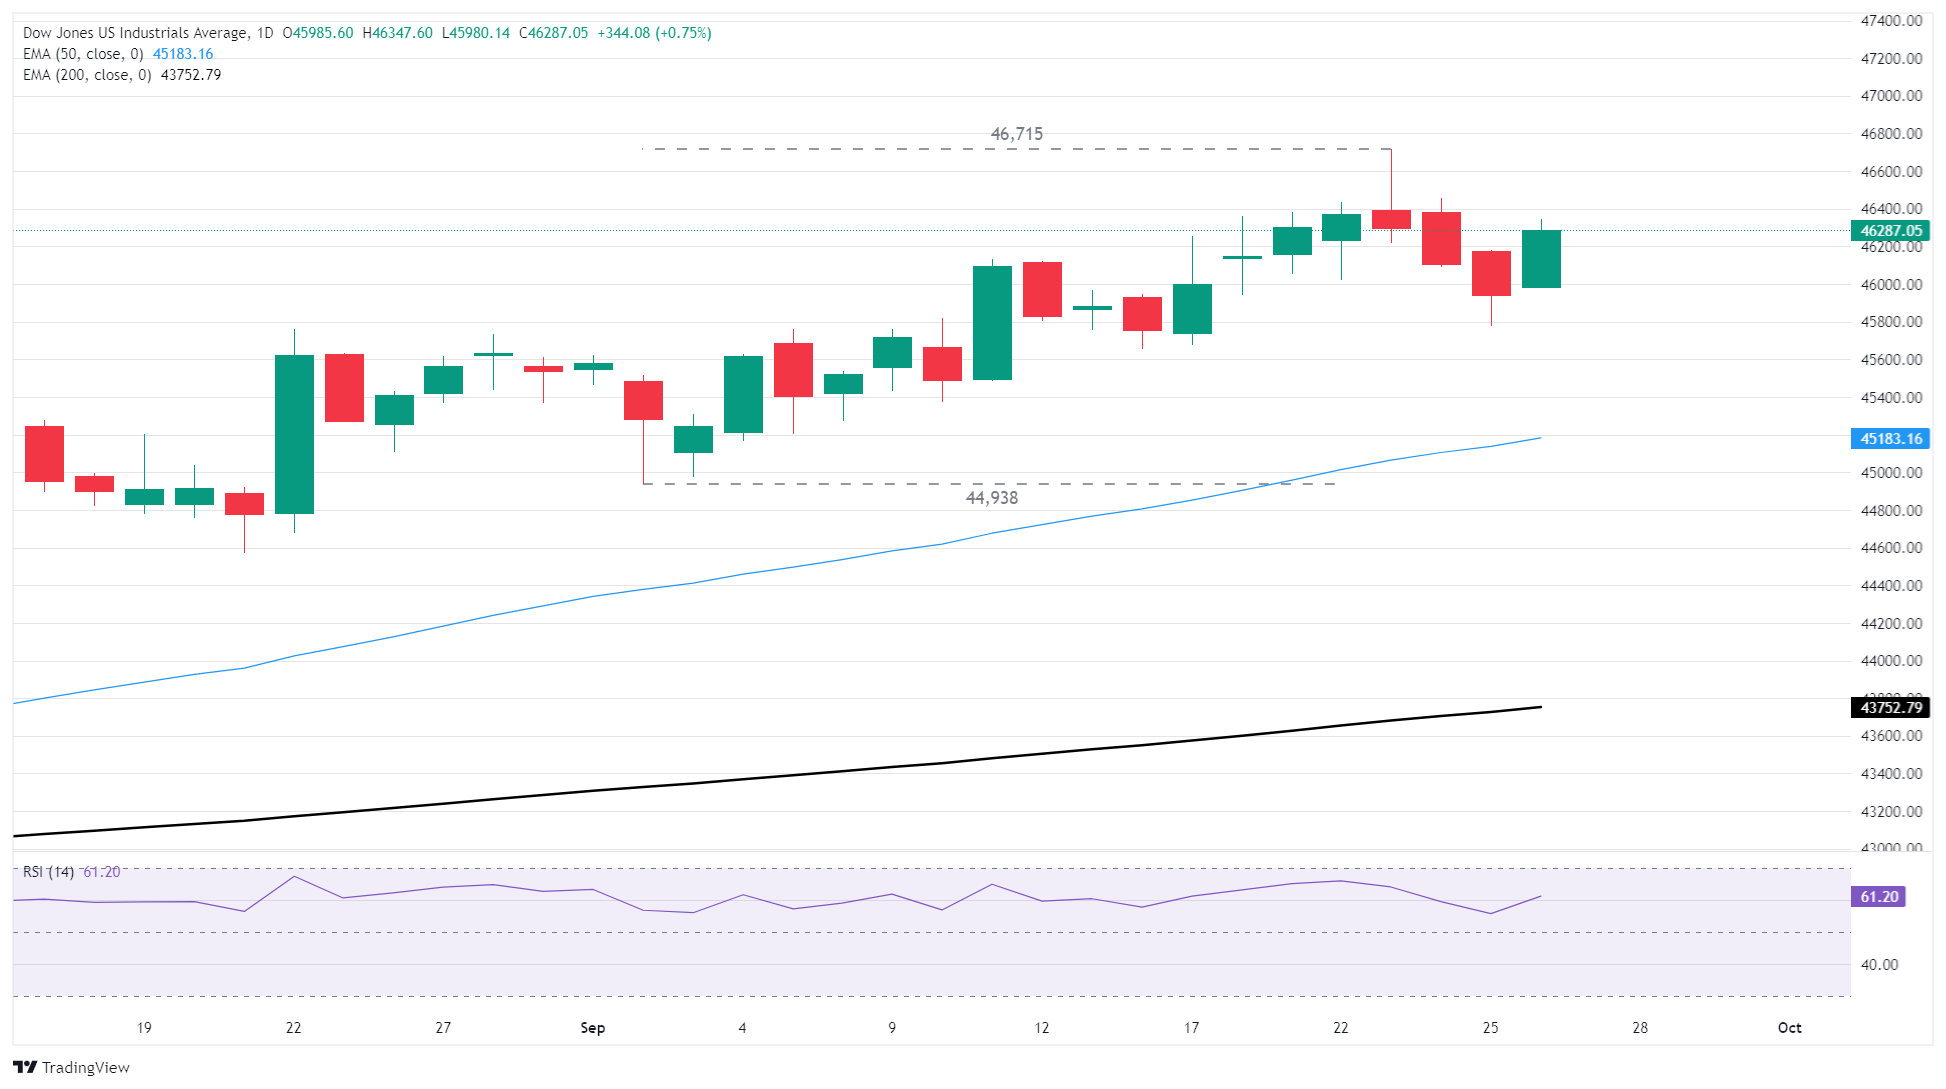
- The Dow Jones rebounded over 350 points on Friday, climbing back above 46,000.
- Fed rate cut expectations are still on track after PCE inflation met market forecasts.
- Despite a coolish print, inflation continues to hold on the wrong side of the Fed’s 2% annual target.

The Dow Jones Industrial Average (DJIA) rebounded on Friday, paring away the midweek’s losses and recovering footing as investors self-soothe over odds of a follow-up interest rate cut in October. US Personal Consumption Expenditures Price Index (PCE) inflation came in about where median market forecasts predicted, keeping market hopes for an October rate trim on the high side.
Inflation holds steady, keeping rate cut bets on balance
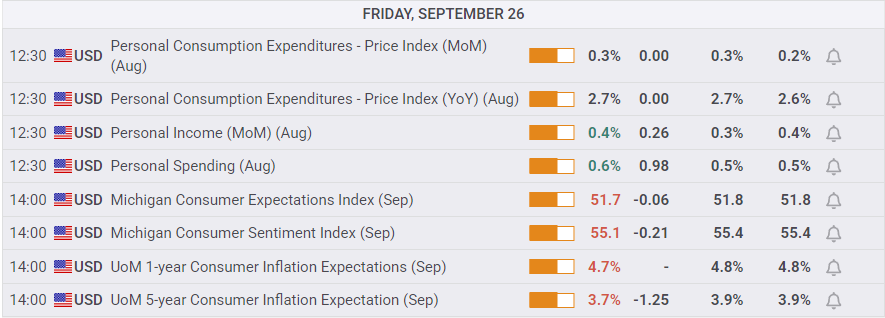
Core PCE inflation held steady at 2.9% on an annual basis, meeting market forecasts. The monthly figure also held flat at 0.2% MoM, while headline PCE inflation accelerated to 0.3% MoM and 2.7% YoY. The US economy is now eight months into its “one-time inflation passthrough” from the Trump administration’s tariffs, and core annual PCE inflation metrics are at the same level they were nearly 18 months ago in March of 2024.

Despite the lack of meaningful progress on inflation, markets are still leaning into the bullish side as Friday’s PCE inflation print was not high enough to spark any concerns about the Fed falling back into hawkish territory. Amid a slumping labor market, the Fed is still on track to deliver a second straight quarter-point interest rate cut on October 25th. According to the CME’s FedWatch Tool, rate traders are pricing in nearly 90% odds that the Fed will deliver a 25 bps rate trim to match the opening rate cut from September’s rate meeting.
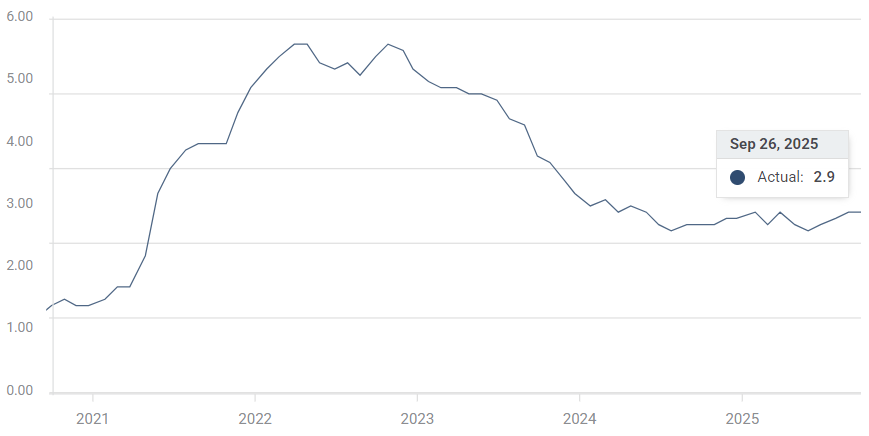
Core PCE inflation, YoY
Personal Income and Personal Spending both rose in August, climbing to 0.4% and 0.6%, respectively. While rising income and consumption metrics are positive signs for the US economy, accelerating wage pressures could bolster inflation metrics in the future, complicating the Fed’s path to a fresh rate-cutting cycle.
Consumer sentiment eases slightly, but plenty of work still on the cards
September’s University of Michigan (UoM) Consumer Expectations and Sentiment Indexes both declined slightly from the previous month, but again, the data was mostly in line with market expectations. UoM 5-year and 5-year Consumer Inflation Expectations also ticked lower in September, but the topline figures are still riding high at 4.7% and 3.7%, respectively.
Consumers have a strong tendency to overshoot realistic outcomes, but such consistently high figures over time could be a warning of overly price-sensitive consumers’ inflation expectations becoming entrenched in a self-fulfilling prophecy. As long as consumers continue to expect above-pace inflation, businesses will be more inclined to meet those expectations.
Dow Jones daily chart
Economic Indicator
Core Personal Consumption Expenditures - Price Index (YoY)
The Core Personal Consumption Expenditures (PCE), released by the US Bureau of Economic Analysis on a monthly basis, measures the changes in the prices of goods and services purchased by consumers in the United States (US). The PCE Price Index is also the Federal Reserve’s (Fed) preferred gauge of inflation. The YoY reading compares the prices of goods in the reference month to the same month a year earlier. The core reading excludes the so-called more volatile food and energy components to give a more accurate measurement of price pressures." Generally, a high reading is bullish for the US Dollar (USD), while a low reading is bearish.
Read more.Last release: Fri Sep 26, 2025 12:30
Frequency: Monthly
Actual: 2.9%
Consensus: 2.9%
Previous: 2.9%
Source: US Bureau of Economic Analysis
After publishing the GDP report, the US Bureau of Economic Analysis releases the Personal Consumption Expenditures (PCE) Price Index data alongside the monthly changes in Personal Spending and Personal Income. FOMC policymakers use the annual Core PCE Price Index, which excludes volatile food and energy prices, as their primary gauge of inflation. A stronger-than-expected reading could help the USD outperform its rivals as it would hint at a possible hawkish shift in the Fed’s forward guidance and vice versa.
Author

Joshua Gibson
FXStreet
Joshua joins the FXStreet team as an Economics and Finance double major from Vancouver Island University with twelve years' experience as an independent trader focusing on technical analysis.
















