Dow Jones Industrial Average declines over 200 points after cool PPI print
- The Dow Jones bottomed out on Wednesday despite a better-than-expected PPI inflation print.
- Equities are tilted into the high end as rate cut bets continue to climb.
- Most of the post-PPI gains are limited to AI and tech supplier stocks, with key domestic players still declining.

The Dow Jones Industrial Average (DJIA) missed the mark on Wednesday, shedding over 250 points from the open. US Producer Price Index (PPI) inflation came in below expectations, bolstering bets of interest rate cuts from the Federal Reserve (Fed) next week.
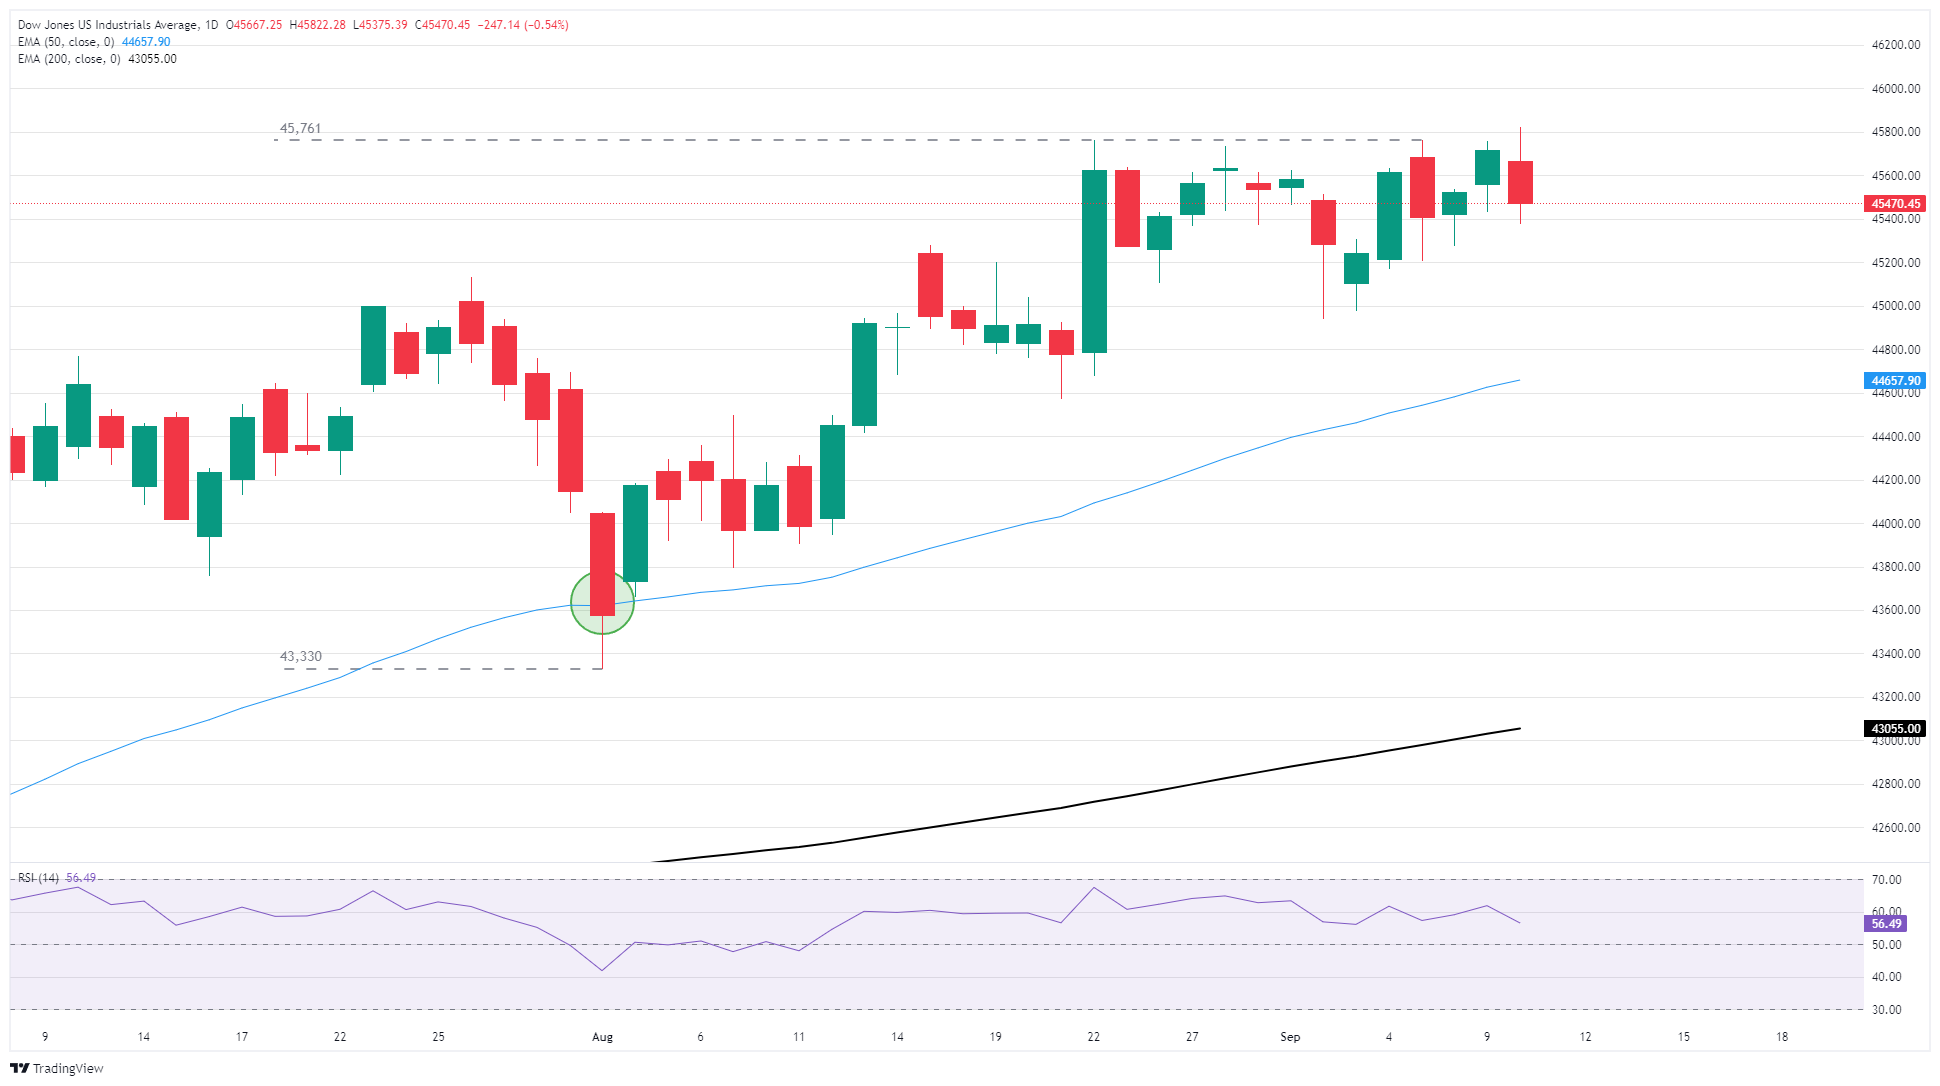
The Dow Jones briefly tested record highs above 45,800 on Wednesday, but the major equity index pivoted into the bearish side, shedding nearly 450 points peak-to-trough before finding a tentative foothold near 45,500. The Dow is still holding close to all-time highs, but bullish momentum is struggling to find the gas pedal. The 50-day Exponential Moving Average (EMA) is rising quickly into the 44,700 region and could pose a fresh technical challenge (or target) for short pressure.
PPI inflation eases back, supporting rate cut hopes
US PPI inflation came in much cooler than expected, prompting another fresh push into bets that the Fed will pick up its pace of interest rate cuts heading into year end. Headline PPI inflation eased to 2.6% YoY in August, while the monthly figure showed a 0.1% contraction.
The upbeat producer-level inflation print prompted another social media volley from US President Donald Trump, claiming that Fed Chair Jerome Powell is “too late” and needs to cut interest rates “now”. Apparently, the current 1600 Pennsylvania Avenue resident remains unaware that the head of the Fed cannot unilaterally change interest rates on a whim.
PPI inflation is a unique beast; producer-level inflation specifically excludes any products or supply chains that incorporate any foreign goods, meaning PPI is accidentally a fantastic way to measure inflation pressures within the US economy outside of any price volatility impacts from tariffs. However, consumer-level inflation metrics continue to show ongoing upside pressure, implying that any inflation effects chewing away at the US economic center is specifically laid at the feet of Trump’s trade hysterics. The latest US Consumer Price Index (CPI) inflation print is due on Thursday, and it is expected to show another uptick in headline consumer-level inflation.
Despite domestic-to-foreign price pressure complications, rate markets are still pricing in over 90% odds that the Fed will deliver a quarter-point rate cut at next week’s upcoming Federal Open Market Committee (FOMC) interest rate decision. However, bets of a jumbo 50 bps double cut have declined to below 10% after peaking near 20% on Tuesday.
Read more stock news: Oracle's RPO rally is a sight to behold, shares up 40%
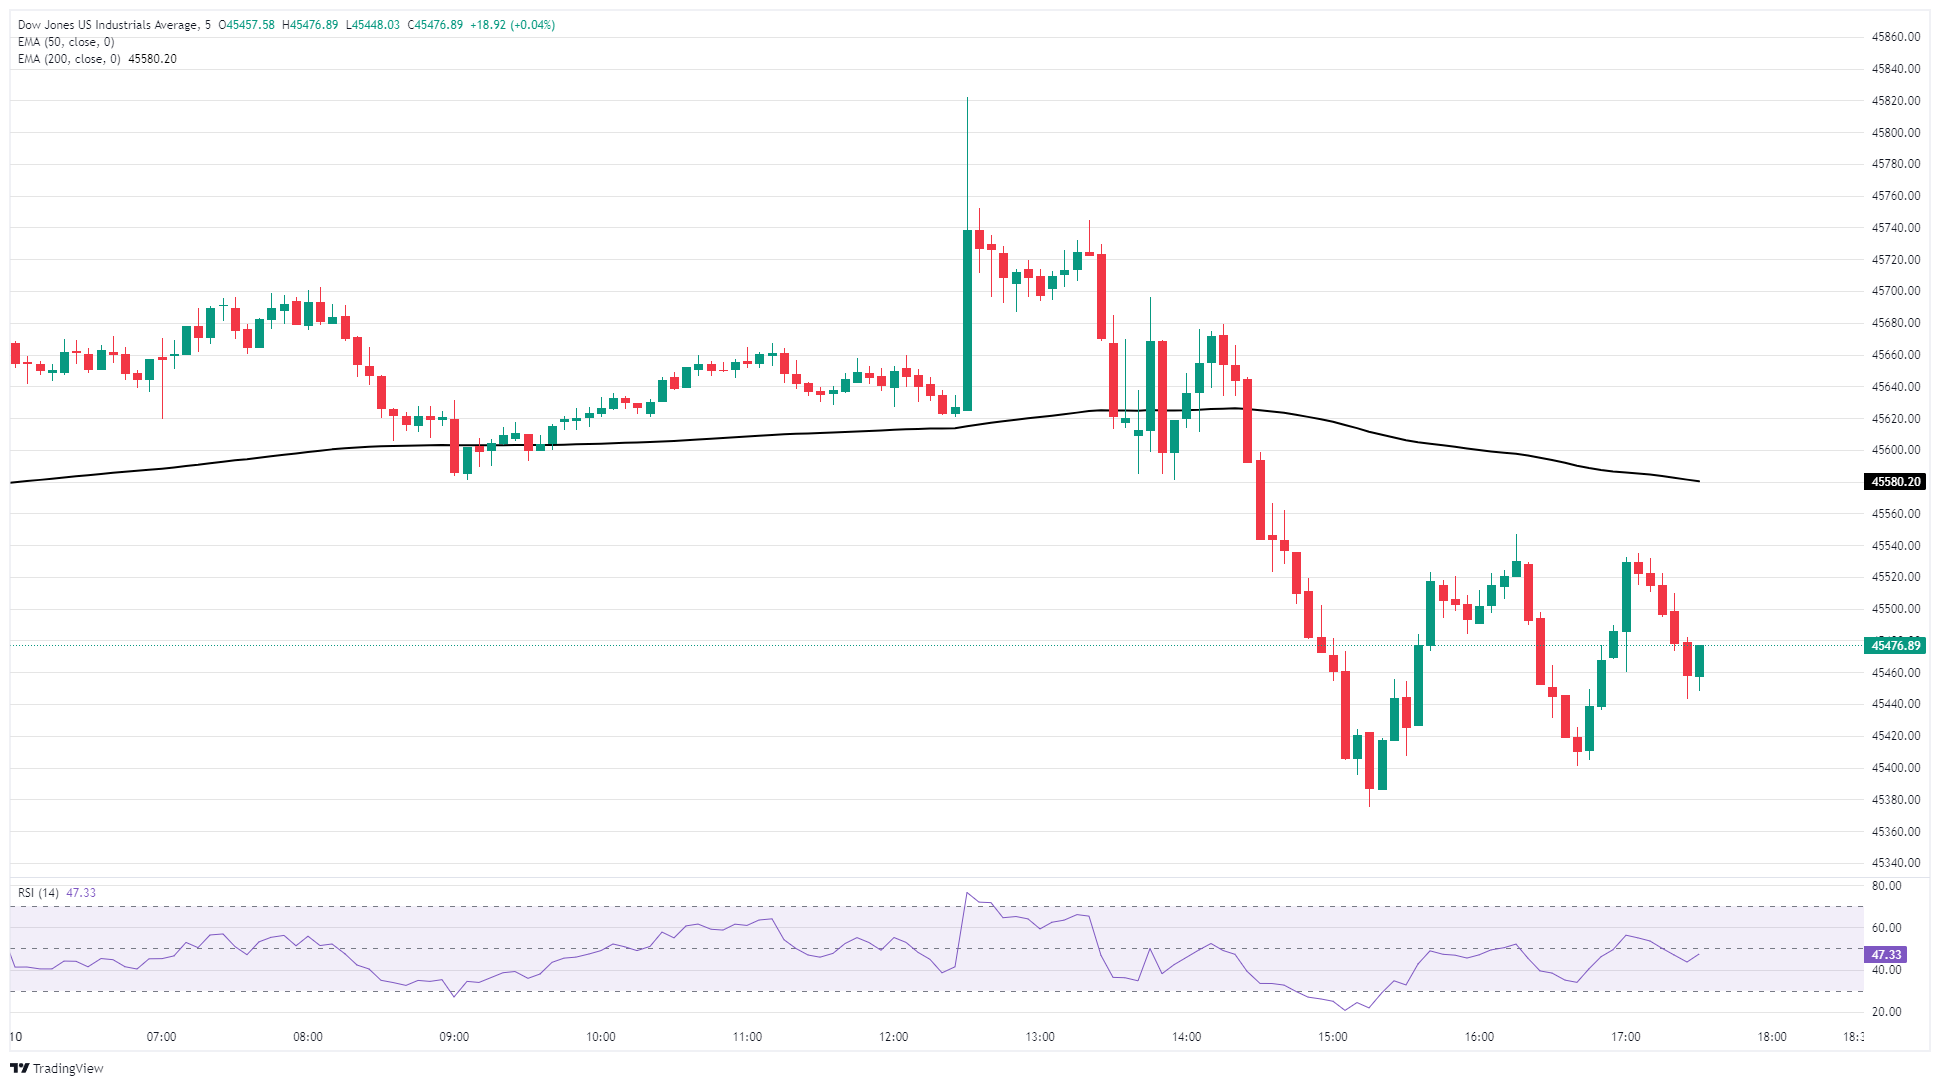
Dow Jones 5-minute chart
Dow Jones daily chart
Dow Jones FAQs
The Dow Jones Industrial Average, one of the oldest stock market indices in the world, is compiled of the 30 most traded stocks in the US. The index is price-weighted rather than weighted by capitalization. It is calculated by summing the prices of the constituent stocks and dividing them by a factor, currently 0.152. The index was founded by Charles Dow, who also founded the Wall Street Journal. In later years it has been criticized for not being broadly representative enough because it only tracks 30 conglomerates, unlike broader indices such as the S&P 500.
Many different factors drive the Dow Jones Industrial Average (DJIA). The aggregate performance of the component companies revealed in quarterly company earnings reports is the main one. US and global macroeconomic data also contributes as it impacts on investor sentiment. The level of interest rates, set by the Federal Reserve (Fed), also influences the DJIA as it affects the cost of credit, on which many corporations are heavily reliant. Therefore, inflation can be a major driver as well as other metrics which impact the Fed decisions.
Dow Theory is a method for identifying the primary trend of the stock market developed by Charles Dow. A key step is to compare the direction of the Dow Jones Industrial Average (DJIA) and the Dow Jones Transportation Average (DJTA) and only follow trends where both are moving in the same direction. Volume is a confirmatory criteria. The theory uses elements of peak and trough analysis. Dow’s theory posits three trend phases: accumulation, when smart money starts buying or selling; public participation, when the wider public joins in; and distribution, when the smart money exits.
There are a number of ways to trade the DJIA. One is to use ETFs which allow investors to trade the DJIA as a single security, rather than having to buy shares in all 30 constituent companies. A leading example is the SPDR Dow Jones Industrial Average ETF (DIA). DJIA futures contracts enable traders to speculate on the future value of the index and Options provide the right, but not the obligation, to buy or sell the index at a predetermined price in the future. Mutual funds enable investors to buy a share of a diversified portfolio of DJIA stocks thus providing exposure to the overall index.
Author

Joshua Gibson
FXStreet
Joshua joins the FXStreet team as an Economics and Finance double major from Vancouver Island University with twelve years' experience as an independent trader focusing on technical analysis.


