Dow Jones Industrial Average dips as AI investments drive broader market gains
- The Dow Jones eased back below 47,500 on Monday, though losses remain limited.
- Equity markets are overall higher to start the new trading week as Mag 7 investment roulette continues.
- ISM PMI data showed a slight easing in business sentiment, but the index remains within normal levels.

The Dow Jones Industrial Average (DJIA) faced fresh declines on Monday, kicking off the new trading week with a 200-point decline. The Dow briefly tested below the 47,250 level for the first time in over a week, as 'Magnificent 7' concentrated investment gains lift other indexes.
Amazon (AMZN) saw a fresh rally on Monday, climbing around 5% after the internet ownership and baubles shipping giant announced a deal to invest $38 billion in ChatGPT maker OpenAI. Iren (IREN) data center supplier also inked its own $9.7 billion deal with Microsoft to provide additional hardware architecture to meet the ever-growing LLM tech growth demand. At the top of the pile, the lone chipmaker giant at the top of the AI tech mountain Nvidia (NVDA) climbed 3.7% as both of the AI investment deals announced on Monday will involve providing access to Nvidia hardware.
ISM PMIs show businesses still struggling with cautious buyers
The latest Institute for Supply Management (ISM) Purchasing Managers Index (PMI) report dipped to 48.7 in October, missing expectations and falling back slightly from September’s 49.1. Demand indicators within the ISM report broadly improved over the month, however all still remain in contraction territory, implying businesses are struggling to find new customers or convince current clients to expand operations. Overall, manufacturing activity among businesses that bothered to submit responses to surveys showed a net decline in economic activity in the manufacturing sector for an eighth straight month.
The Federal Reserve’s (Fed) speech patterns have taken a hard left turn as of late, veering into a more chaotic presentation than usual as policymakers’ opinions begin to deviate from a carefully crafted consensus. Investors have grown used to a certain level of organized pageantry from Federal Reserve talking points, but a brave new world has opened up before markets based on Fed Chair Jerome Powell’s surprisingly cautious stance at the Fed’s latest rate call. Fed officials also gave a rare three-way vote last week, with a few flyaway voters advocating for even steeper rate cuts or no cuts at all.
The shifting stance within the Fed has thrown market expectations for a December interest rate cut into jeopardy. According to the CME’s FedWatch tool, rate traders are still pricing in over 65% odds that the Fed will deliver a third straight interest rate cut on December 10; however, the majority of rate market bettors see even greater odds that the Fed will be pushed into waiting until January to deliver another 25 basis point rate cut.
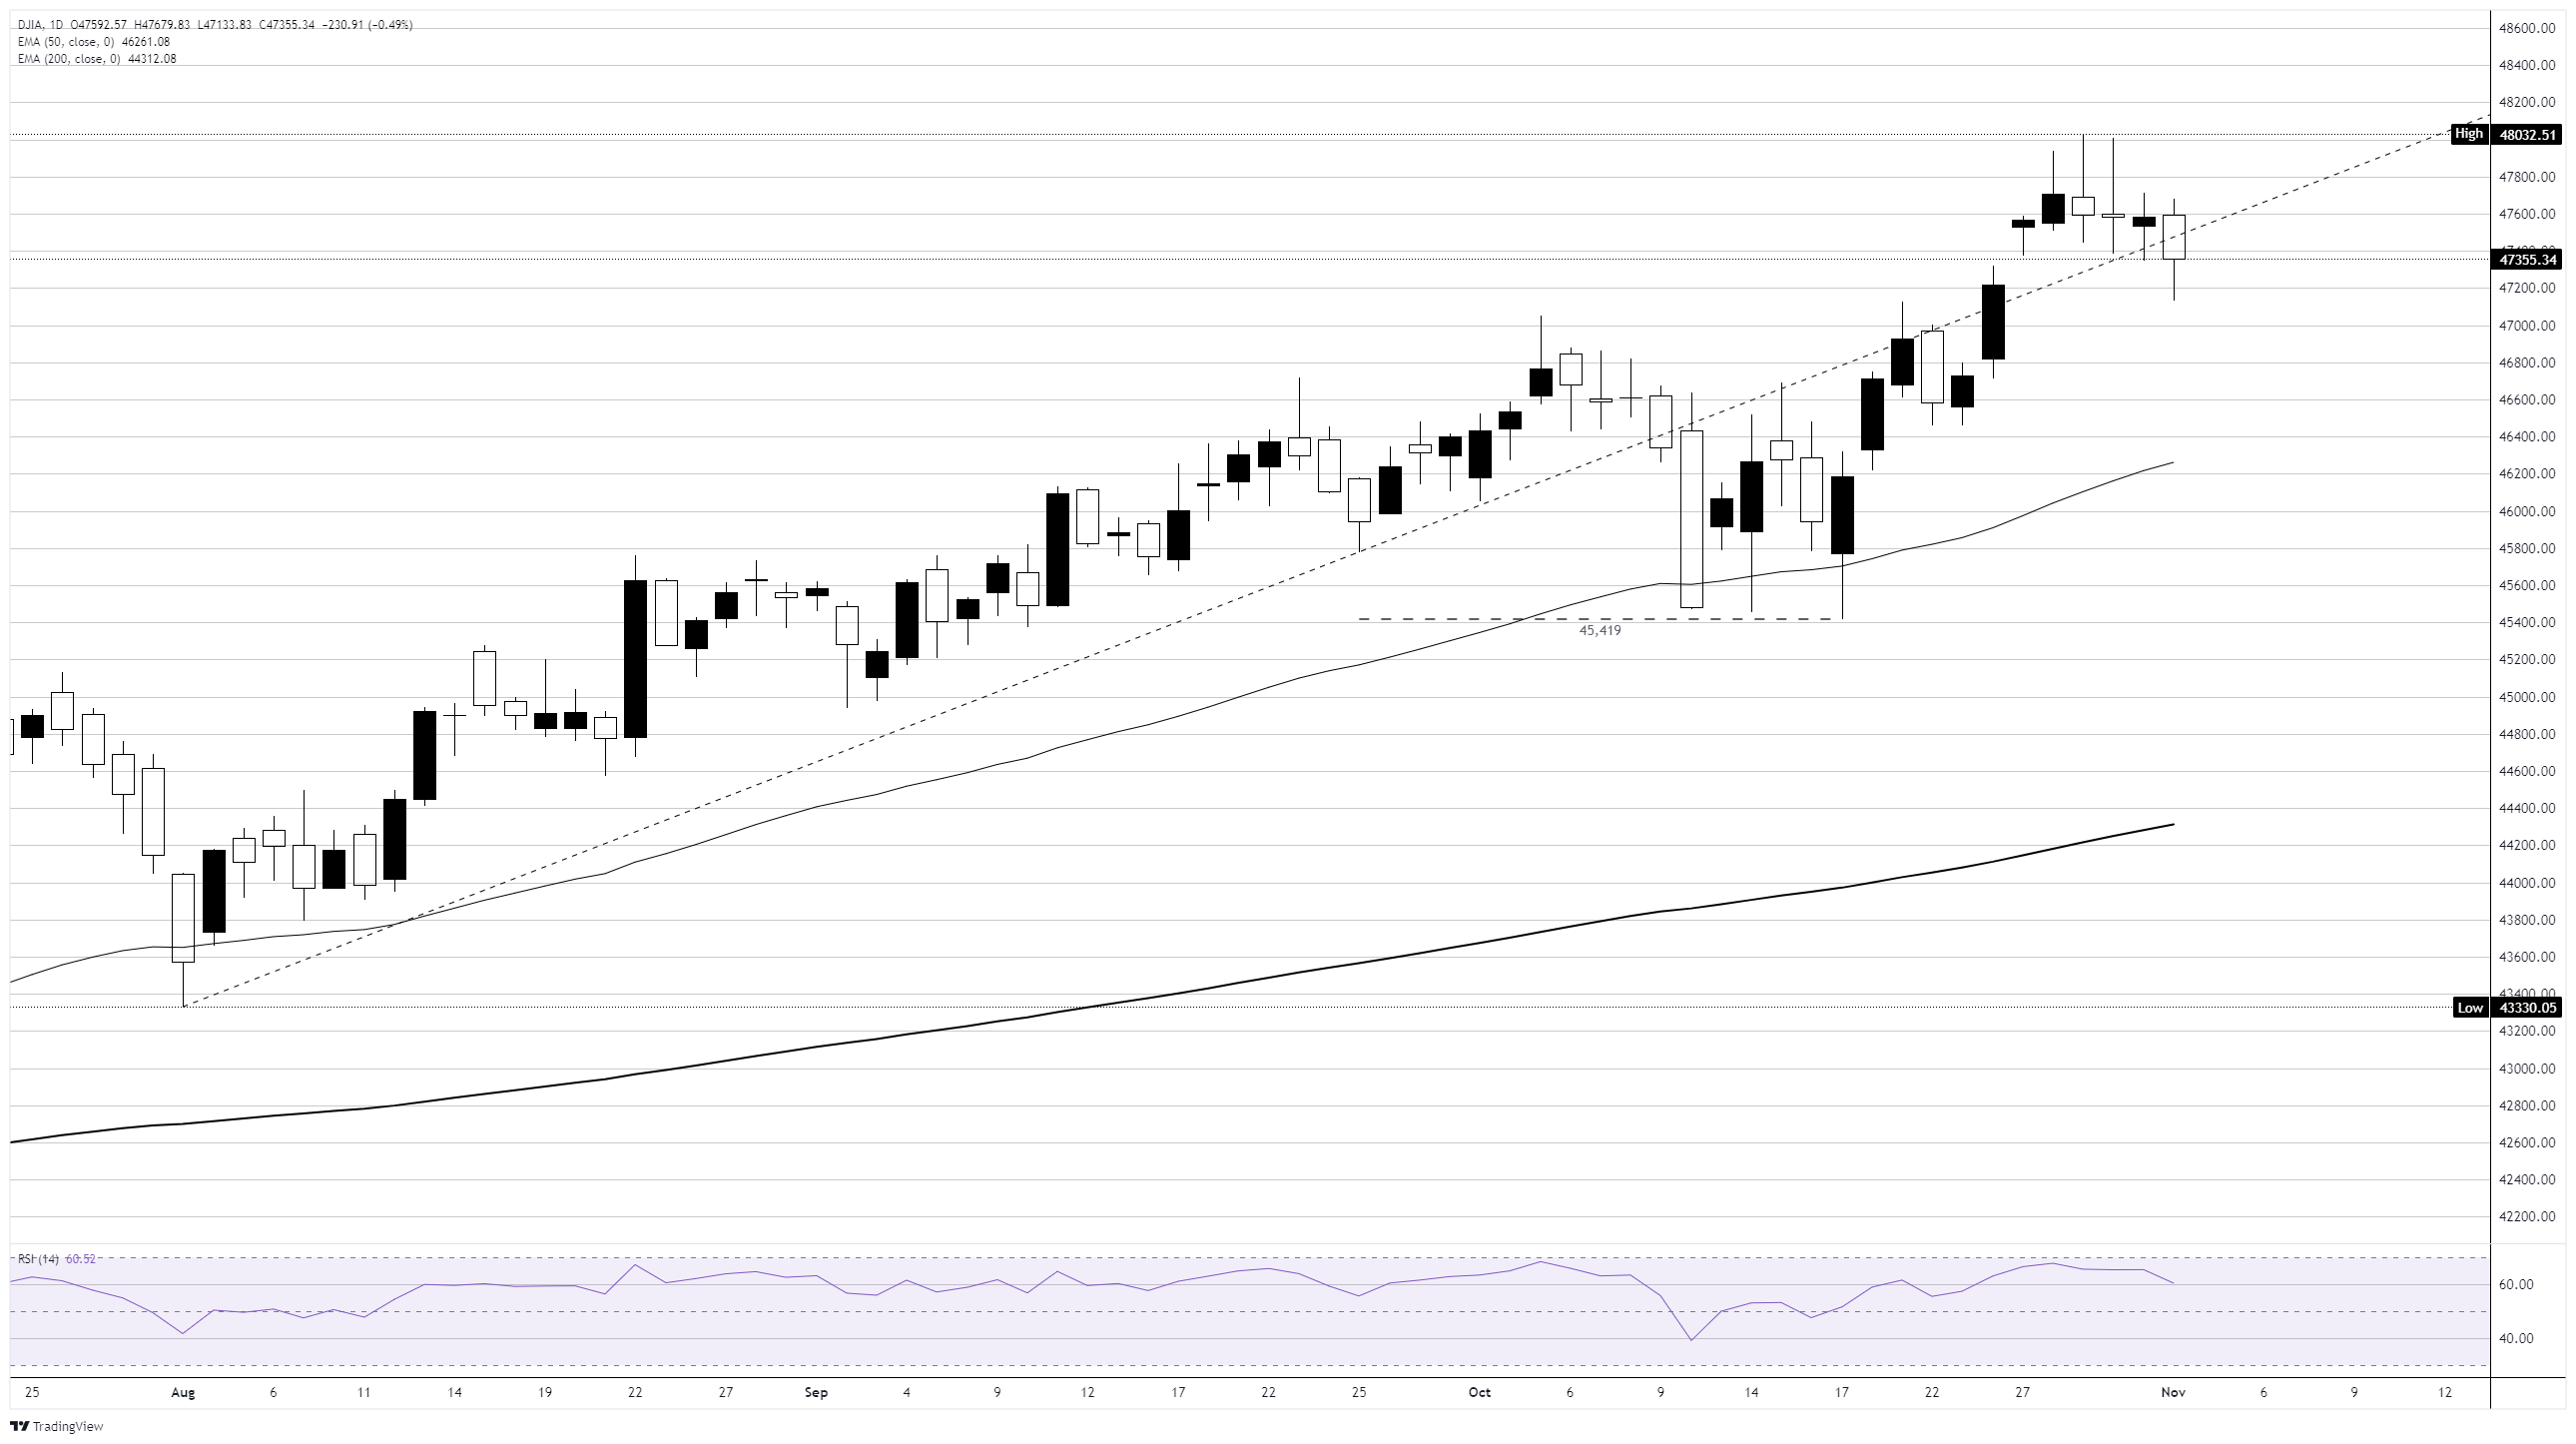
Dow Jones daily chart
Economic Indicator
S&P Global Manufacturing PMI
The S&P Global Manufacturing Purchasing Managers Index (PMI), released on a monthly basis, is a leading indicator gauging business activity in the US manufacturing sector. The data is derived from surveys of senior executives at private-sector companies from the manufacturing sector. Survey responses reflect the change, if any, in the current month compared to the previous month and can anticipate changing trends in official data series such as Gross Domestic Product (GDP), industrial production, employment and inflation. A reading above 50 indicates that the manufacturing economy is generally expanding, a bullish sign for the US Dollar (USD). Meanwhile, a reading below 50 signals that activity in the manufacturing sector is generally declining, which is seen as bearish for USD.
Read more.Last release: Mon Nov 03, 2025 14:45
Frequency: Monthly
Actual: 52.5
Consensus: 52.2
Previous: 52.2
Source: S&P Global
Author

Joshua Gibson
FXStreet
Joshua joins the FXStreet team as an Economics and Finance double major from Vancouver Island University with twelve years' experience as an independent trader focusing on technical analysis.


